Waiker, an AI company specializing in the securities market, is supplying AI data to Kakaopay Securities. Using ontology-based technology, the company automatically classifies and tags real-time data to reduce irrelevant data noise and provides it in a format that can be accurately utilized by various digital services and LLMs.
ㅤ
With this implementation, Kakaopay Securities can now refine vast news streams with accurate and consistent metadata, enabling faster and personalized stock news discovery, alerts, and risk insights for users.
ㅤ
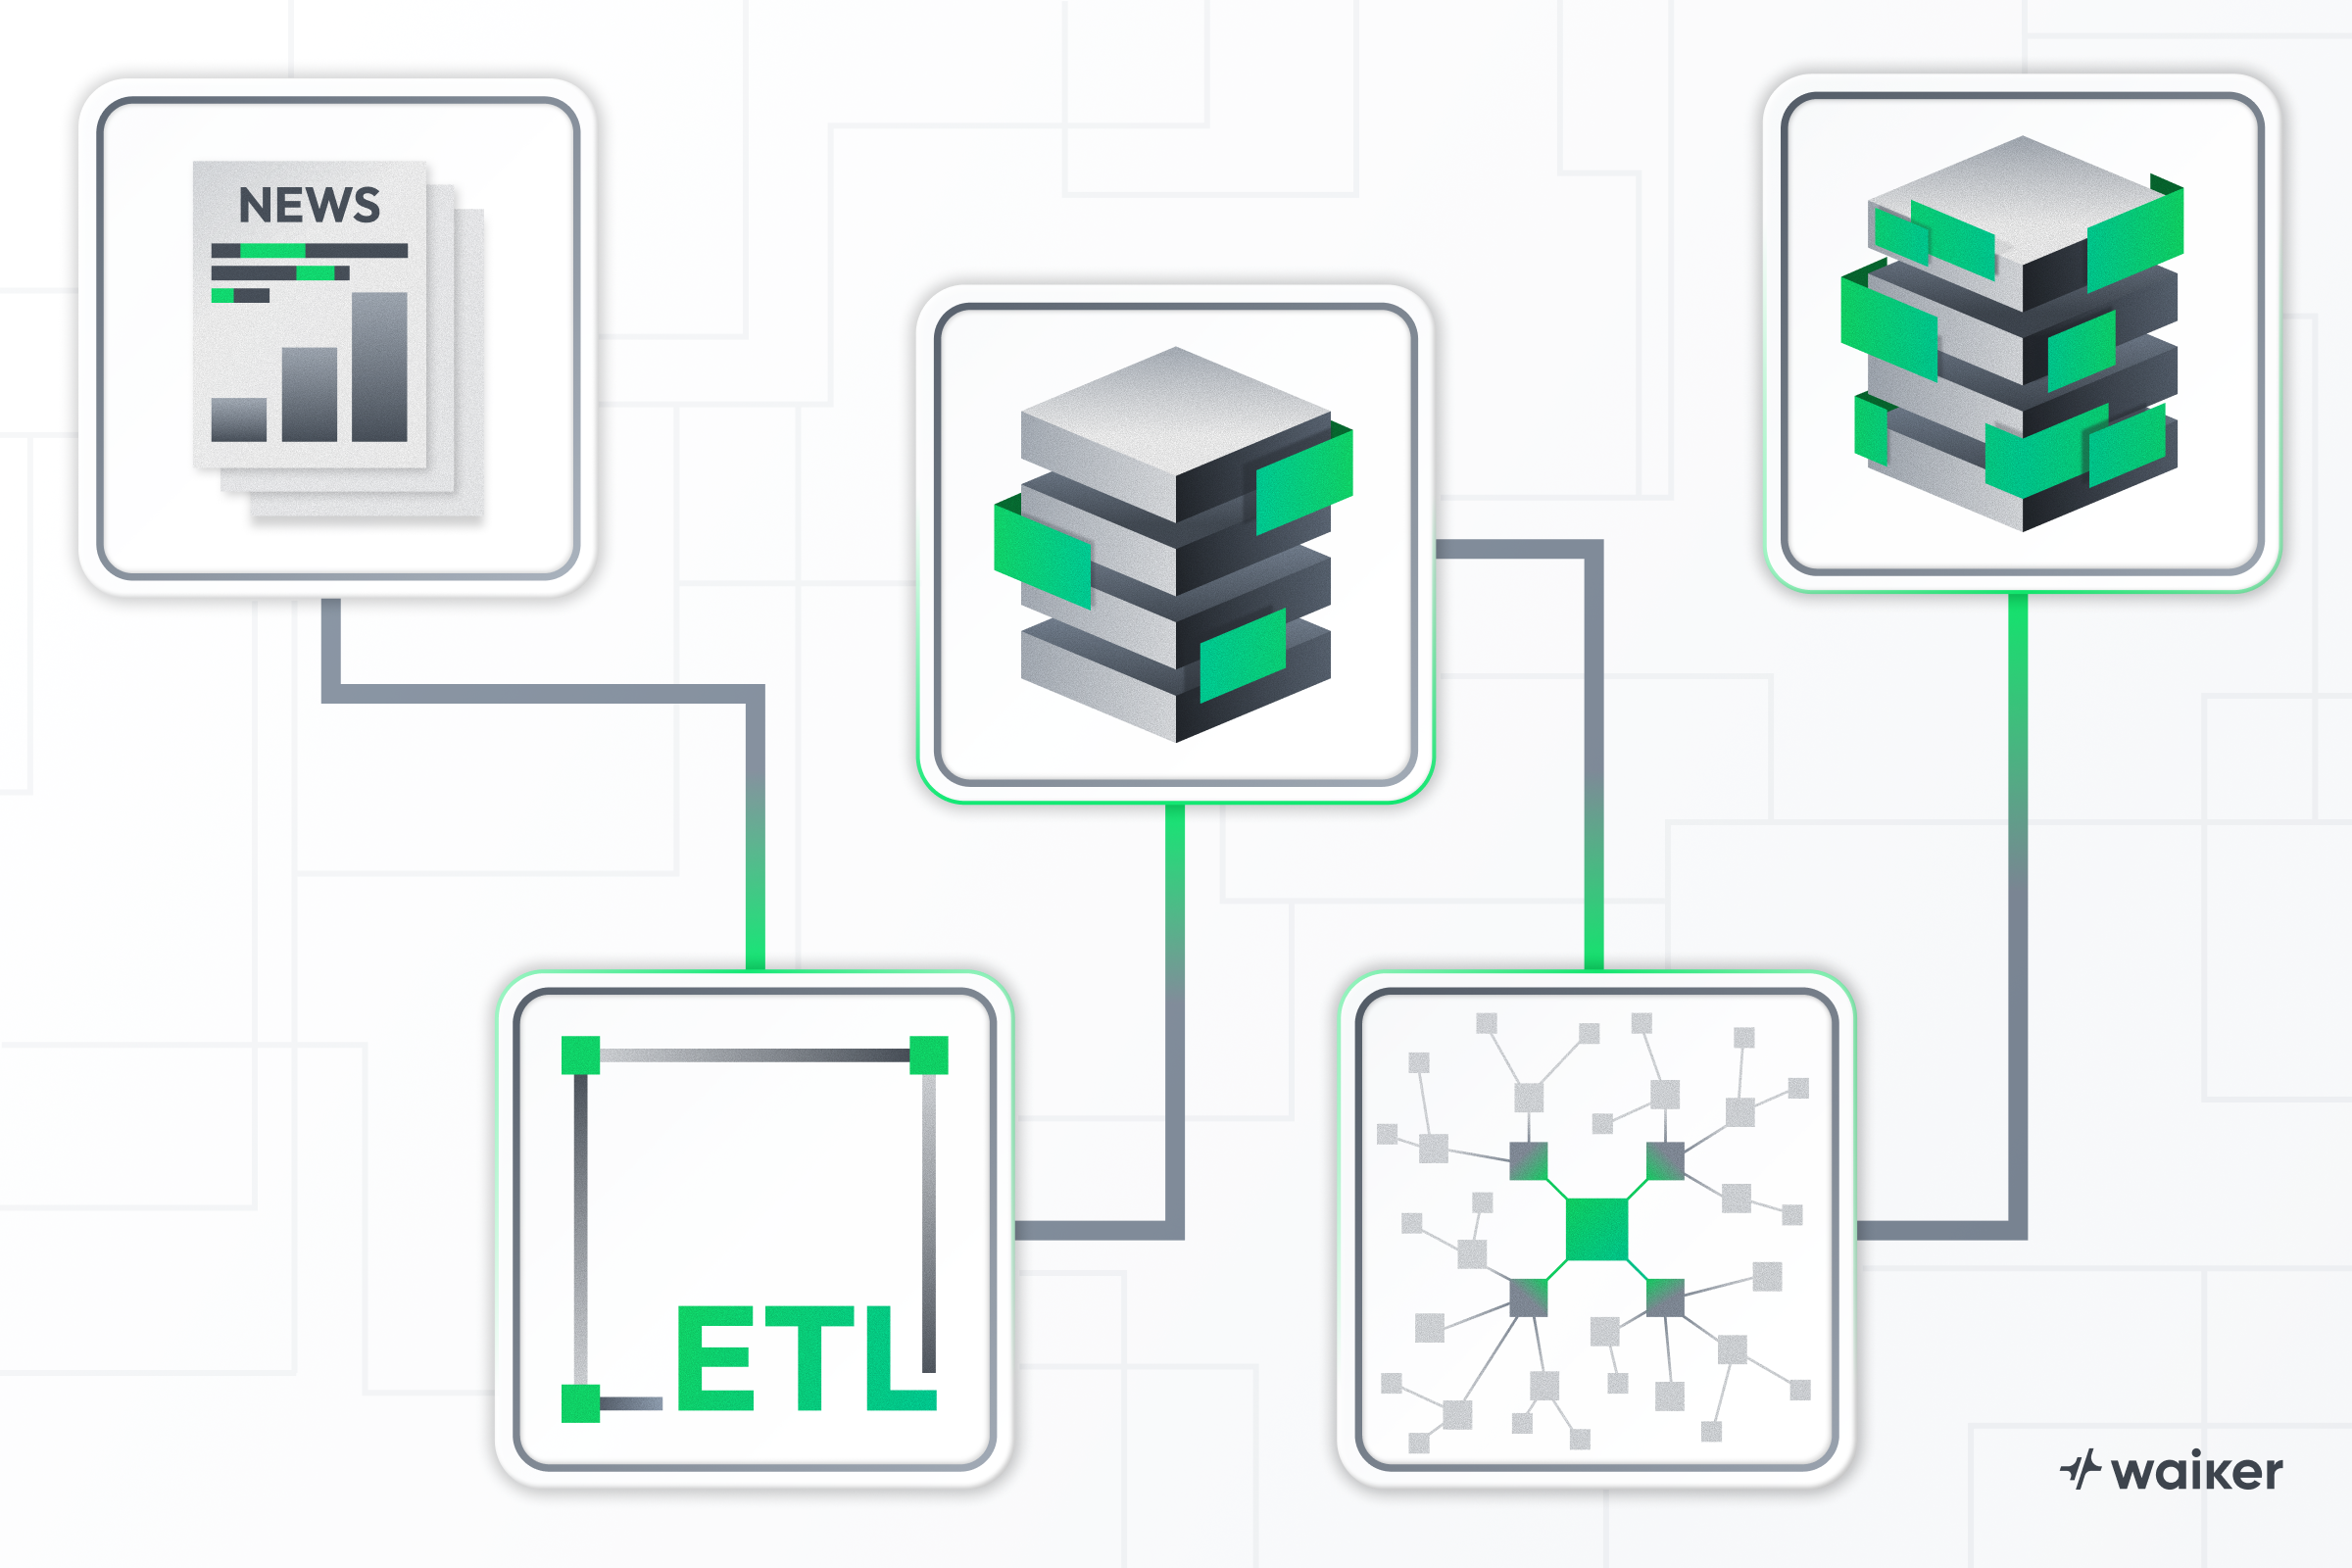
Waiker continues its specialized AI R&D with ontology-based AI labeling as its core strength. The company has been building an ‘AI-ready database’ that facilitates AI utilization by extracting, transforming, and loading (ETL) unstructured text from global stock markets, then applying its proprietary classification system. The pipeline is designed to automatically assign various metadata including topics, industry codes, events, and stock tickers during this process.
ㅤ
Kyu-jong Hwang, CEO of Waiker, stated, “With AIX, the era of vast real-time data experiences that can become noise for users will come to an end, and providing optimized data will become universal. We provide AI-labeled data that helps investors make investment decisions suited to their situations and preferences, making it well-utilized not only by digital platforms but also by LLMs. Waiker’s AI Labeler assigns correlations and priorities between nodes through tags and relevance to vast global news, helping maximize our clients’ business performance and investors’ utility.”
ㅤ
Kakaopay Securities adopted Waiker’s specialized AI after confirming superior quality compared to general-purpose LLMs in Reuters original text processing, stock tagging, and filtering. Based on this, they are enhancing the quality of news services within individual stock pages.
ㅤ
Industry experts point to data filtering and readability as key factors in improving reliability, especially as fatigue increases in mobile brokerage environments due to duplicate articles, incomplete stock mapping, and low relevance. Waiker’s data can be utilized through API/MCP formats and is applied to stock-specific news screens in the Kakaopay Securities app.
ㅤ
Since its establishment approximately 6 years ago, Waiker has conducted R&D as an AI company specializing in securities market data, supplying data not only to domestic securities firms like Shinhan Investment Securities and Hana Securities but also to data vendors like Koscom, operating stable real-time customer services with AI technology.
ㅤ
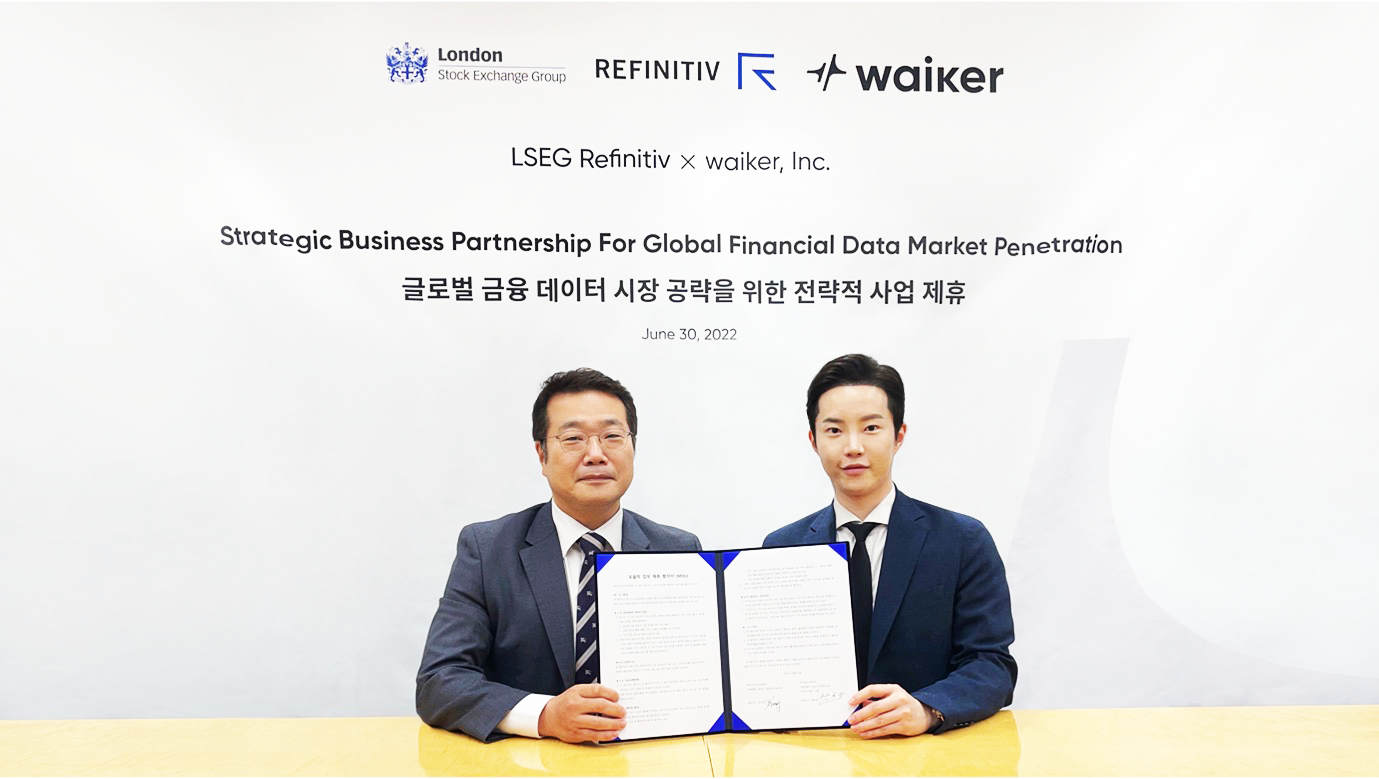
The company states its goal is “to create an experience where users feel optimized data utility with reduced noise by assigning meaning and priority to data, enabling better investment decision-making.” To expand this data experience to global clients, the company continues licensing and joint ventures with LSEG Data & Analytics (formerly Refinitiv) for unstructured stock market data.