Category: Insights

  • How to Utilize Passive Fund Holdings Data?

    Today, we would like to introduce our newly released Passive Fund or ETF (Exchange-Traded Fund) holdings data and discuss how to use this data effectively.

    What is Passive Investing?

    Photo by Precondo CA on Unsplash

    First, passive investing is an investment strategy that seeks to track the performance of a specific index or benchmark. Unlike actively managed funds, passive funds don’t involve portfolio managers actively selecting stocks or timing the market. Instead, they simply reflect the market index.

    Commonly known ETF products fall under passive investing and are typically associated with lower management fees and the potential for stable, long-term returns.

    1. Cost Efficiency: Passive funds generally have lower management fees compared to active funds, positively impacting investors’ long-term returns.

    2. Transparency: Since these funds track the the entire market or a specific index, the composition of the investment portfolio is clear and transparent.

    3. Diversification: Investing in a wide range of assets allows effective risk diversification across different stocks or industries.

    Market Shift: From Active Funds to Passive Funds

    Recent Passive Fund Trends

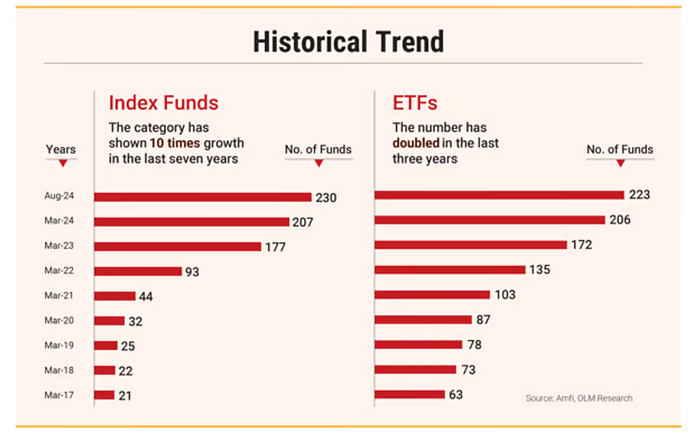
    Traditionally, fund managers have preferred active investment strategies. However, as the graph above shows, passive fund growth has surged in recent years.

    ETFs, in particular, offer investors convenient access to various asset classes, attracting both individual and institutional investors.

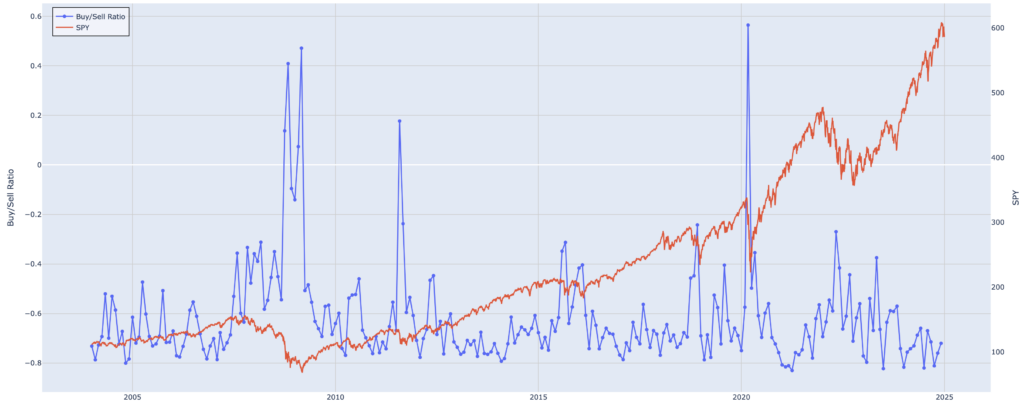
    Even in Korea, retail investors investing in U.S. markets have become familiar with tickers like SPY and QQQ, reflecting the growing popularity of passive investing.

    How to Use ‘Passive Fund Holdings’ Data?

    Example: Passive Funds Tracking the S&P 500

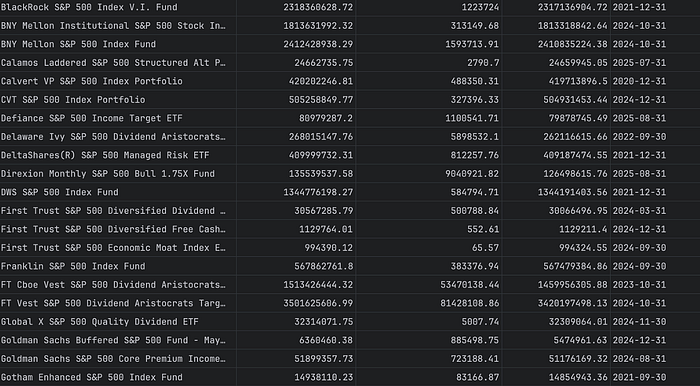
    The first way to utilize Waiker’s Passive Fund Holdings Data is by easily identifying ETFs and index funds that track a specific index.

    The image above shows search results for passive funds that track the S&P 500 or its derivatives. With Waiker’s data, you can easily view a list of passive funds following the index and gain quick insights into their size (assets, liabilities, etc.).

    Second Use Case: Identifying Tracking Errors

    Waiker’s data also provides the fund’s Net Asset Value (NAV), making it easier to calculate tracking errors. This allows you to conveniently apply trading strategies based on the difference between market prices and NAV.

    Tracking error is a crucial metric that shows how faithfully a fund replicates its target index. A lower tracking error means the fund reflects the index more accurately, which enhances investor confidence.

    Third Use Case: Utilizing Rebalancing Dates

    Index providers recalculate and manage the composition of the index on predetermined dates, such as quarterly or semi-annually.

    Inclusions and exclusions of specific stocks in an index can be interpreted as major positive or negative signals, making it important for investors to monitor these changes and dates carefully.

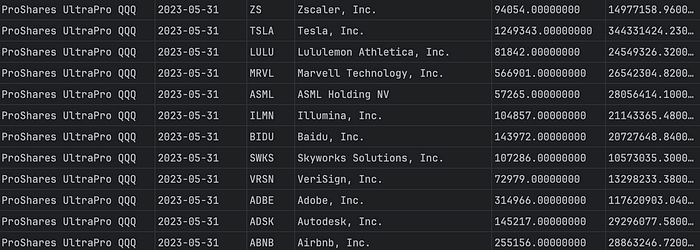
    The following example shows the holdings of a specific ETF. As of May 31, 2023, ProShares UltraPro QQQ held 1,249,343 shares of Tesla.

    ETF Holdings Data

    While passive funds primarily track specific indices, the composition and weighting of holdings can vary by fund.

    For instance, while the S&P 500 consists of 503 stocks, an actual fund might only hold 501 stocks. Therefore, understanding how many funds hold specific stocks, and to what extent, can help estimate potential buying or selling volumes on rebalancing dates.

    Passive Investing: Beyond Market Average Returns

    While passive investing is generally a strategy aimed at achieving market-average returns, passive fund data has evolved beyond that purpose.

    By applying precise data analysis, investors can optimize quantitative investment strategies using ETFs.

    In this article, we briefly introduced several strategies:

    1. Listing passive funds that track specific indices

    2. Optimizing ETF selection using tracking error analysis

    3. Developing precise investment strategies based on rebalancing timing

    How are you using ETF data? If you have your own passive investment strategies, feel free to share them!

    John C. Bogle:

    “Don’t look for the needle in the haystack. Just buy the haystack!”

  • Cluster Trading Analysis on Insider Transactions

    What is Cluster Trading?

    Cluster trading refers to the scenario where insiders of a company engage in similar transactions (buying or selling) within a specific period. When insiders, who have deeper knowledge of a company’s internal matters, engage in such actions, their trading behavior can provide useful insights into the company’s future prospects, potentially influencing stock prices. Furthermore, if multiple insiders simultaneously engage in transactions in the same direction, it can increase the reliability of the information from those insider trades.

    This hypothesis was empirically tested using insider trading data from Waiker.

    Analytical Method

    1. Definition of Cluster Trading:
      • A cluster trade is defined when at least 4 insiders trade in the same direction (buying or selling) within 30 days of the initial insider trade date.
    2. Performance Measurement:
      • The performance of stock price is tracked for up to 60 trading days following the initial insider trade date to calculate cumulative returns.
    3. Cluster vs Non-Cluster:
      • Cluster trades are compared with non-cluster trades (defined as insider trades that do not meet the 4 insiders threshold).
      • Average cumulative returns for both cluster and non-cluster trades are calculated for comparison.
    4. Comparison of Results:
      • The performance of cluster trades is compared with non-cluster trades over various timeframes (20, 40, 60 trading days) to analyze the potential benefit of cluster trading.

    Results of the Analysis

    • Cluster Trading Outperforms Non-Cluster Trading:
      • Non-cluster trades exhibit lower returns compared to cluster trades at 20, 40, and 60 trading day intervals (as seen in the blue-highlighted cells in the table below).
      • Annualized Returns:
        • At the 20 trading-day mark, cluster trading yields 11.31% higher returns than non-cluster trading.
        • At the 40 trading-day mark, cluster trading outperforms by 14.53%.
        • At the 60 trading-day mark, cluster trades result in 9.05% higher returns.
    • Cluster Trades Show Consistent Performance Over Time:
      • Cluster trades demonstrate a steady performance over time, while non-cluster trades do not show similar long-term results.
    • Optimal Holding Period:
      • The best performance for cluster trades occurs with a 20 trading-day holding period, which indicates that the value of the insider information from cluster trading diminishes over time.

    Key Findings

    • Cluster Trading Signals:
      • When 4 or more insiders engage in buying transactions within the past month and there are no selling trades, the likelihood of a positive performance is high.
    • Cluster Trading Stability:
      • Cluster trades tend to provide more stable and consistent returns than non-cluster trades.

    Performance Summary:

    Cluster PeriodNumber of InsidersSample SizeBuy/Sell20-Day Avg. Return (Annualized)40-Day Avg. Return (Annualized)60-Day Avg. Return (Annualized)
    Cluster Trading4 Insiders32,524Buy2.49% (34.4%)3.74% (24.65%)4.34% (18.52%)
    Non-Cluster68,429Buy1.75% (23.09%)1.62% (10.12%)2.29% (9.47%)

    Note: The table presents both the cumulative returns and their annualized values for comparison.

    Time-series Changes in Average Return

    Conclusion

    • Cluster Trading’s Advantage:
      • Insider transactions that occur in clusters (with 4 or more insiders trading in the same direction) significantly outperform non-cluster trades in terms of return.
      • Cluster trading tends to provide more consistent and stable returns, especially when compared to non-cluster trades.
      • Optimal Holding Period: The ideal holding period for cluster trades is 20 trading days, beyond which the value of the insider information tends to decrease.
    • Insights for Investors:
      • Cluster trades offer a strong signal for investors looking for stable returns and insider-driven insights into stock price movements.
    • Data Availability:
      • Detailed cluster trading data is provided by Weikher’s Insider Trading Database, allowing investors to access valuable insights on insider trading patterns and trends.

  • The Value of U.S. House Representatives’ Stock Transaction Data

    The Value of U.S. House Representatives’ Stock Transaction Data

    Backtesting the stock trading data of U.S. House members from Waiker’s politician transaction dataset revealed that many U.S. politicians achieved market-beating returns in 2023. The dataset allows for the examination of returns by individual politicians and their affiliated parties. The results suggest that certain politicians may have benefited from an informational advantage inaccessible to the general public. Below are some particularly noteworthy statistics:

    1. Key Returns and Performance

    The top 5 House members by stock trading returns in 2023 are as follows:

    • Democratic Rep. Brian Higgins: 238.9%

    • Republican Rep. Mark Green: 122.2%

    • Republican Rep. Garret Graves: 107.6%

    • Republican Rep. David Rouzer: 105.6%

    • Democratic Rep. Seth Moulton: 80%

    Additionally House Speaker Nancy Pelosi recorded a return of 65.5%, ranking among the higher-performing members.

    Given that the S&P 500 Index recorded an annual return of 23.8% in 2023, these results indicate substantial outperformance. Notably, Democratic Rep. Brian Higgins achieved a remarkable return of 238.9%, a performance level far beyond what most average investors could expect.


    From a party perspective:

    • Democratic House members recorded an average return of approximately 33.0%,

    • Republican House members achieved an average return of 19.0%.

    The higher returns of the ruling Democratic Party members are analyzed as a result of the government promoting policies to support sustainable technological innovation. Democratic lawmakers tend to focus their investments in sectors such as artificial intelligence (AI), cloud computing, and renewable energy technologies.

    The report shows that lawmakers have a tendency to concentrate their investments in specific industries. Notably, the technology and energy industries were the sectors that garnered the most interest among politicians throughout 2023, reflecting the policy differences and interests of each party in their trading tendencies.

    Conclusion

    Politician transaction data is not merely intriguing but serves as a valuable tool for investors to develop actionable strategies. Politicians are often directly or indirectly exposed to critical information related to economic policies, legislative changes, and industry regulations. Analyzing trading patterns based on this information offers practical insights for predicting market trends.

    By studying the industries that politicians frequently trade in or the timing of their concentrated transactions, investors can better anticipate which sectors might experience future growth. Actively analyzing such data can enhance investors’ ability to predict significant market changes and adapt their strategies accordingly.

  • Seeking alpha in US senators’ stock transactions

    Seeking alpha in US senators’ stock transactions

    To analyze the relationship between information asymmetry and the returns generated when U.S. senators use political information to trade stocks, this review examines the study titled “A Dilemma of Self-interest vs Ethical Responsibilities in Political Insider Trading” by Jan Hanousek et al., published in the Journal of Business Ethics in October 2022. The study empirically investigates whether senators’ stock trades contradict social contract theory and explores the informational value of their transactions.

    Methodology

    This study is based on a dataset of 8,064 securities transactions, including 7,092 stock trades disclosed by U.S. senators under the STOCK Act between 2012 and 2019. To measure the information asymmetry associated with senators’ transactions, the study employs Abnormal Idiosyncratic Volatility (AIV), a metric that captures changes in stock volatility during specific events and is particularly suited for evaluating the likelihood of trades based on insider information.

    Key Points of Methodology

    • Abnormal Idiosyncratic Volatility (AIV): This measures the level of information asymmetry by analyzing volatility changes around trading days compared to normal periods.

    • Event Window: A 5-day event window (2 days before and after the trade day, including the trade day) was used to calculate abnormal volatility and compare it with other periods.

    • Focus: The study sought to determine whether senators’ trades generated higher AIV than major corporate events like quarterly earnings announcements or mergers and acquisitions (M&A), linking political insider information to stock returns.


    AIV Calculation

    1. Transaction Volatility (IVATT): Daily volatility during the 5-day event window was measured, excluding market-wide factors.

    2. Non-Transaction Volatility (IVNAT): Volatility during other periods of the year was calculated similarly.

    3. AIV: The difference between IVATT and IVNAT. A higher AIV indicates a greater likelihood that specific information influenced the stock on the transaction day.


    The study confirmed that senators’ stock trades are associated with significant abnormal returns. Specifically:

    • Stocks traded by senators recorded an average excess return of 4.9% over three months after the transaction date.

    • As shown in the data, senators’ trades consistently outperformed the market over holding periods of 1 week, 2 weeks, 1 month, 2 months, and 3 months.


    In terms of information asymmetry, senators’ trades recorded an average Abnormal Idiosyncratic Volatility (AIV) of 3.6%, which is three times higher than the 1.1% AIV observed during major corporate earnings announcements. This indicates that senators’ stock transactions are accompanied by significant information asymmetry.

    Such asymmetry suggests that the political information held by senators carries substantial value in the stock market and demonstrates that senators participate in market transactions from a privileged position of informational advantage over other investors.

    Conclusion

    This study confirms that senators’ stock trades induce information asymmetry and exhibit a strong correlation with stock price volatility. Specifically, the timing of their transactions aligns with heightened AIV, indicating that the information senators use is indeed reflected in stock prices.

    The existence of information asymmetry between U.S. politicians and the general public, coupled with the fact that senators achieve market-beating returns by holding stocks for three months after their purchases, suggests that trading based on senators’ political information could hold value as an investment strategy.

  • How are stock purchase disclosures by politicians related to stock prices?

    How are stock purchase disclosures by politicians related to stock prices?

    To explore the relationship between U.S. politicians’ stock purchase disclosures and stock returns, I reviewed the article titled “Perceptions of Political Self-Dealing? An Empirical Investigation of Market Returns Surrounding the Disclosure of Politician Stock Purchases,” published in the Strategic Management Journal in October 2022.

    Hypotheses and Methodology

    Hypothesis 1: The disclosure of stock purchases by senators will trigger a positive market reaction for the respective company’s stock.

    Hypothesis 2: If a senator serves on a committee that oversees a specific company, the market reaction will be stronger.

    Hypothesis 3a, 3b, 3c: When the company has lobbied on the senator’s legislation, testified in a committee where the senator serves, or has connections with the senator through campaign contributions, the market reaction to the senator’s stock purchase disclosure will be amplified.

    Methodology

    • Event Study and Cumulative Abnormal Return (CAR) Calculation: To measure the abnormal returns before and after the disclosure of senators’ stock purchases, they used the Fama-French 4-factor model to calculate CAR. They analyzed stock price changes across various event windows (e.g., disclosure day and the following day (0, +1), etc.).

    • Cross-Sectional Regression Analysis: To examine the impact of variables such as committee membership, lobbying activities, and campaign contributions on market reactions, they conducted an OLS regression analysis.

    • Information Asymmetry Check: To ensure that no information was leaked prior to the disclosure, they reviewed media coverage and conducted an additional event study for the actual purchase date.

    Between 2012 and 2020, 2,234 instances of senators’ stock purchases were used as the sample for Hypothesis 1, and 2,066 instances were used as the sample for the other four hypotheses.

    The above table shows the cumulative average abnormal returns (CAAR) analysis results for the impact of senators’ stock purchase disclosures on stock prices.

    Both the equally-weighted index (where equal weights are given to each event) and the value-weighted index (considering each stock’s market capitalization) recorded positive CAAR across all four event windows. The standardized cross-sectional test and the generalized sign Z values also show statistically significant p-values, supporting Hypothesis 1 that the market reacts positively for a certain period after a senator’s purchase disclosure.

    Table 2 reveals daily abnormal returns, capturing the stock price reaction before and after the senator’s stock purchase disclosures.

    On the disclosure day, the equally-weighted and value-weighted abnormal returns were 0.09% and 0.11%, respectively, both statistically significant. Conversely, before the disclosure, abnormal returns were either negative (D-3, D-2) or positive but not statistically significant (D-1, p>0.1). Thus, Table 2 provides evidence for Hypothesis 1, showing a positive market reaction on the disclosure day and the days following it.

    Finally, Table 3 uses cross-sectional analysis to examine the factors influencing abnormal returns following senators’ stock purchase disclosures.

    This analysis uses Ordinary Least Squares (OLS) regression to understand how various factors affect stock prices when senators’ stock purchases are disclosed. Each coefficient in the table indicates the effect of independent variables on CAAR.

    • Senator jurisdiction * lobbying the senator: When senators have lobbied for legislation benefiting a specific company, it has a significant positive impact on abnormal returns (coefficient 0.39, p = 0.02), supporting Hypothesis 3a.

    • Senator committee jurisdiction: When a senator serves on a committee overseeing the company’s industry, abnormal returns increase significantly (coefficient 0.57, p = 0.01), supporting Hypothesis 2.

    • Senator jurisdiction * campaign contributions: When companies make campaign contributions to senators, abnormal returns increase (coefficient 0.15, p = 0.02), indicating that campaign contributions may signal a positive relationship between the senator and the company, supporting Hypothesis 3c.

    • Senator jurisdiction * congressional testimony: The coefficient for this variable is -0.36, but the p-value is 0.35, which is not statistically significant. Therefore, Hypothesis 3b is rejected.

    Summary

    In summary, this study identifies short-term profit opportunities following senators’ stock purchase disclosures. Additionally, analyzing the historical or current relationships between senators and companies, such as committee memberships or lobbying connections, may also reveal opportunities for abnormal returns.

    Explore opportunities for generating abnormal returns by leveraging Waiker’s politician trading data.

  • Insider Buy/Sell Ratio and Market Trends

    Insider Buy/Sell Ratio and Market Trends

    Understanding market trends goes beyond price charts and economic indicators—sometimes, the most revealing signals come from within companies themselves. Insider trading data offers a unique lens into how corporate leaders view their own businesses, especially during times of market turbulence. In this article, we explore the relationship between the Insider Buy/Sell Ratio and the performance of the S&P 500 ETF (SPY), uncovering how insider behavior can serve as a powerful indicator of market sentiment and potential turning points.


    The chart above showcases a comparative analysis of the Insider Buy/Sell Ratio and the performance of the S&P 500 ETF (SPY) over time.

    Understanding the Buy/Sell Ratio

    The Buy/Sell Ratio is calculated as follows.

    1. Identify the number of stocks with positive insider net purchases (where net buy volume > 0) and compare it to the number of stocks with negative net purchases (where net buy volume < 0).

    2. Divide the former by the latter and subtract 1, creating an indicator that captures insider trading behavior within the market.

    This ratio is visualized as a time series on the primary y-axis (left), with markers and lines representing its trend.

    Description

    The chart clearly highlights key moments when the Buy/Sell Ratio spikes, coinciding with significant downturns in the broader stock market, as indicated by the S&P 500 ETF (SPY), plotted on the secondary y-axis (right).

    During periods of substantial market decline, insiders appear to increase their buying activity relative to selling. This behavior likely reflects their confidence in the long-term value of their companies, suggesting that insiders perceive these periods as opportunities to accumulate shares at discounted prices.

    Key Insights

    1. Market Declines Trigger Insider Activity: Noticeable spikes in the Buy/Sell Ratio occur during major market sell-offs, such as the financial crisis of 2008, the COVID-19 crash in early 2020, and other correction phases. These spikes suggest that insiders may act contrarian to the broader market sentiment, buying heavily when prices drop.


    2. Buy/Sell Ratio as a Contrarian Indicator: The trend indicates that the Buy/Sell Ratio could serve as a contrarian signal, potentially identifying periods of market pessimism where insiders foresee recovery or undervaluation.


    Implications

    This analysis underscores the potential predictive value of insider trading data. By tracking insider sentiment, market participants can gain insights into periods of heightened conviction among company insiders, particularly during market stress.

    The synchronization of these two metrics provides a fascinating perspective on market dynamics and insider confidence, offering a valuable tool for traders, investors, and researchers seeking to understand market cycles.

  • How Can U.S. Politician Trading Data Be Used for Investment?

    How Can U.S. Politician Trading Data Be Used for Investment?

    1. Why is U.S. Politician Trading Data Important?

    The stock trades of U.S. politicians hold particularly significant information for investors. U.S. politicians have the authority to propose or pass bills that directly impact the economy and industries. When politicians buy or sell large amounts of a specific company’s stock, it can hint at the government’s future policy direction for that company or industry. For example, if a politician who supports electric vehicles or renewable energy purchases stocks in that sector, it may indicate potential future policy support for these areas.

    2. Collection and Verification of Politician Trading Data

    Politician trading data is collected through various channels, and it’s crucial to verify this data and make it reliable. In the U.S., major asset movements by politicians are reported by regulatory agencies such as the SEC (Securities and Exchange Commission). Our company utilizes a strong QC system to collect and verify data from multiple sources, thereby enhancing data integrity and providing investors with highly reliable information.

    3. AI-Based Error Detection and Pattern Analysis

    Politician trading data involves various variables, and precise data analysis is essential for providing investment insights. Our AI-based error detection system automatically detects abnormal or unusual patterns in politicians’ stock trading records. For example, if a certain politician buys a large volume of stocks in a related industry right before proposing a bill, our AI quickly identifies this and can alert investors. This analysis helps in understanding the correlation between politicians’ actions and policy changes.

    4. Investment Strategies Utilizing Politician Trading Data

    Using U.S. politician trading data, investors can gain clearer insights into the future direction of industries and potential policy changes. For example, if key politicians sell healthcare company stocks while a healthcare reform bill is under discussion in Congress, this might signal that the bill may not pass or could negatively impact the industry. Conversely, if politicians are buying stocks in construction or materials-related companies while an infrastructure-related bill is being discussed, it could indicate stronger policy support for that industry.

    5. Real-World Examples Demonstrating the Importance of Politician Trading Data

    5-a. Nancy Pelosi’s Stock Trades

    Nancy Pelosi, the former Speaker of the U.S. House of Representatives, has long been under scrutiny for her stock trades. In 2021, her husband, Paul Pelosi, made significant profits by trading tech stocks such as Apple and Tesla. At that time, Speaker Pelosi was in a position to influence important legislation involving these companies, raising suspicions around these trades. This incident intensified debates over the potential for politicians to exploit insider information. [Source: Forbes, 2021]

    5-b. The Stock Sale Incident of Richard Burr

    In February 2020, U.S. Senator Richard Burr sold a significant portion of his stock portfolio just before the COVID-19 pandemic began to spread in earnest. He made this decision after receiving a confidential briefing on the economic impacts of the pandemic. After the stock market plunged, Burr’s trades were investigated for insider trading, although no charges were filed. [Source: NPR, 2020]

    5-c. Dick Cheney’s Halliburton Stock Trades

    Former Vice President Dick Cheney faced significant criticism over his stock trades involving Halliburton in the early 2000s, especially concerning the U.S. involvement in the Iraq War. Cheney had served as CEO of Halliburton prior to his vice presidency, and as Vice President, he played a role in securing Iraq War contracts for the company. His stock ownership led to public skepticism over political and ethical issues surrounding his investments. [Source: Time Magazine, 2003]

    6. Investment Insights Through Politician Trading Data

    Politicians’ stock trades provide vital clues to market trends. Politicians often have access to internal policy information, making their trading activities a potentially meaningful signal for the stock market. By leveraging U.S. politician trading data, our investment analysis system connects political movements with resulting market changes, offering timely and practical insights for investors.

    Conclusion: Using Politician Trading Data for Future-Focused Investment Strategies

    U.S. politician trading data offers investors unique and valuable insights. By analyzing this data, investors can understand the correlation between political decisions and industry trends and prepare for future market shifts. With data-driven analysis, investors gain an informational advantage, allowing for more strategic understanding and responses to market movements.

    References

    Summary

    This blog post now includes three different cases: Nancy Pelosi’s stock trading, Richard Burr’s COVID-19-related trades, and Dick Cheney’s Halliburton transactions. These cases demonstrate how politician trading activities have stirred controversy across various contexts, highlighting the significance of such trading as signals for investors.

    Posted by @Ava, @Jake, @Ethan, @Noah

  • How can insider transaction be utilized?

    How can insider transaction be utilized?

    Who is an insider?

    An insider typically refers to company executives and board members. In the United States and Canada, shareholders owning over 10% of voting shares also qualify as insiders, including venture capital firms and investment companies like Berkshire Hathaway. Insider trading encompasses these insiders’ stock buying and selling activities.

    Following Insider Buying

    Insider buying signals confidence, as insiders typically don’t purchase shares when expecting price declines. When multiple insiders buy company stock, it warrants attention.

    Following Insider Selling

    Insider selling patterns can provide valuable trading insights. Studies show that clustered transactions often yield reliable trading signals.

    Key Insider Trading Patterns to Watch

    1. Insider buying carries more weight than selling, as buying typically indicates profit expectation while selling can occur for various reasons.

    Example: [Insider Buying] SNDA / Sonida Senior Living, Inc.
    Sam Levinson purchased approximately 1.05 million shares on February 1, 2024. Following investment funding news, the stock price rose significantly during February-March.

    2. Executive transactions hold greater significance due to their access to critical information.

    3. Small company insider trading often provides more profitable signals due to limited public information.

    4. Clustered transactions offer more reliable signals than individual trades.

    Example: [Cluster Selling] AMR / Alpha Metallurgical Resources Inc.
    Clustered insider selling occurred from late February to early March 2024. Following executive changes and the selling pattern, the stock price declined significantly.

    How to Find Insider Trading Information

    While Form 4 filings can be monitored on the SEC website, this process can be time-consuming. Waiker’s insider trading data API or widget offers a more efficient tracking solution.