Tag: investment analysis

  • Analyzing the Impressive Surge in GITS Stock Price: What Investors Need to Know

    Analyzing the Impressive Surge in GITS Stock Price: What Investors Need to Know
    GITS Stock Analysis Concept

    Understanding the Impressive Surge in GITS Stock: Detailed Analysis

    GITS stock has recently captured the attention of investors with a phenomenal 148.35% surge in its stock price, closing at $2.41. This significant upward movement, coupled with an unusually high volume of 55,486,944 shares traded, calls for a detailed examination. In this article, we’ll dive deep into the possible factors driving this surge, analyze stock trading patterns, and explore potential risks for investors.

    Company Overview and Industry Trends

    GITS operates within a dynamic industry known for technological advancements and rapid market shifts. The company specializes in innovative solutions that cater to both domestic and international markets. Recent trends in the industry suggest a growing demand for technology integration, which may serve as a broader contextual factor influencing GITS’s performance.

    Analyzing the Stock Surge: Intricacies and Influences

    Monday witnessed a remarkable 148.35% increase in GITS’s stock price, a move that has raised eyebrows across the financial community. While no immediate news or official disclosures have directly accounted for this surge, it’s essential to consider possible underlying factors such as institutional trading patterns.

    Potential Institutional Trading Patterns

    When a stock experiences such a dramatic spike without any clear news or disclosures, it often hints at possible institutional involvement. Institutional investors, with their substantial buying power, have the capability to significantly influence stock prices by altering demand and supply dynamics in the market. The massive trading volume, documented at 55,486,944 shares, further supports the hypothesis of institutional trading.

    Insider Trading and Stock Buybacks

    To understand the surge, examining insider trading activities and buyback programs is crucial. As of now, there are no notable insider trading activities or announced stock buyback plans associated with GITS. This absence suggests that the surge might not be directly linked to internal company strategies.

    Comparative Analysis with Historical Patterns

    Historically, stocks that experience similar unexplained upswings often see subsequent volatility. Looking back at comparable situations, initial pricing inflations were sometimes followed by corrections as market participants adjusted their strategies. For retail investors, this highlights the potential risk of volatility.

    Investment Risks and Considerations

    While the surge in GITS stock might look enticing, prospective investors should proceed with caution. The lack of concrete news fueling the price increase underscores the uncertainty surrounding future price stability. Such conditions often attract speculative trading, which can lead to unpredictable price swings.

    Conclusion

    In the absence of specific news, the surge in GITS stock price appears driven by elements such as institutional buying and market speculation. Investors should carefully evaluate the involved risks and keep a keen eye on subsequent announcements or shifts in trading patterns. This event reiterates the importance of thorough research and prudent investment planning.

    For more updates and expert analyses on stock market developments, stay tuned.

    Discover what Waiker can do for your team
  • HBIO Stock Price Soars 135.74%: Analyzing the Unexpected Surge

    HBIO Stock Price Soars 135.74%: Analyzing the Unexpected Surge
    HBIO Stock Analysis Concept

    HBIO Stock Price Soars 135.74%: Analyzing the Unexpected Surge

    In recent trading sessions, HBIO stock saw an extraordinary surge, with its price catapulting to $0.67, marking a 135.74% increase. This unexpected rise has turned many heads in the stock market community, prompting a thorough analysis of the factors that could have influenced this movement.

    Company Overview: Understanding HBIO

    Harvard Bioscience Inc. (NASDAQ: HBIO) is a global developer of innovative scientific instruments used to advance life science and clinical research. With a focus on providing high-quality solutions to scientific problems, HBIO is a key player in the bioscience industry. The company has consistently worked towards solidifying its position amidst rapidly evolving industry trends.

    Industry Trends Influencing HBIO

    The bioscience industry is characterized by rapid technological advancements and a growing emphasis on health research. Companies like HBIO are continuously innovating to meet the needs of modern laboratories and research institutions. The rising demand for more sophisticated scientific tools could be a catalyst for the recent stock price surge.

    Examining the Recent Surge: Price and Volume Analysis

    The dramatic 135.74% surge in HBIO’s stock price was accompanied by an unusually high trading volume of 627,492,974 shares. This surge could potentially indicate a large-scale institutional trading pattern. When a stock experiences such high volume, it often signals heightened interest from institutional investors or a major shift in market sentiment.

    Insider Trading and Buyback Analysis

    As of the data provided, there is no clear indication of insider trading or stock buybacks influencing HBIO’s recent performance. While insider activity and buybacks often precede significant stock movements, their absence suggests that the surge may be more tied to broader market dynamics or external factors.

    Absence of Direct News: Speculating Institutional Activity

    Without specific news disclosures to attribute to the price increase, we turn our attention to institutional trading activity. Large stocks surges without specific catalyst news can sometimes be driven by institutional investors rebalancing portfolios or taking strategic positions. Retail investors should consider this possibility in their analyses.

    Potential Investment Risks

    While the surge in HBIO stock is indeed attention-grabbing, potential investors should be mindful of associated risks. Rapid stock increases can sometimes lead to equally rapid downturns, especially if the rise is speculative rather than news-driven. It’s essential to remain cautious and analyze both technical indicators and fundamental factors before making investment decisions.

    Historical Comparisons and Future Outlook

    Historical analysis of HBIO’s stock performance reveals periods of volatility, a common characteristic in the biotech sector. By comparing this recent surge to past patterns, investors might gauge future movements. While past performance doesn’t guarantee future results, it can offer insights into market behavior.

    As HBIO continues to innovate within the bioscience industry, market participants will be watching closely to see if the current price surge translates into sustained growth. Investors should stay updated on news releases and financial disclosures that could impact future stock valuations.

    Discover what Waiker can do for your team
  • SPRO Stock Surges 244%: Key Factors Behind Spero Therapeutics’ Price Spike

    SPRO Stock Surges 244%: Key Factors Behind Spero Therapeutics' Price Spike
    SPRO Stock Analysis Concept

    Understanding the Surge in SPRO Stock: A Comprehensive Analysis

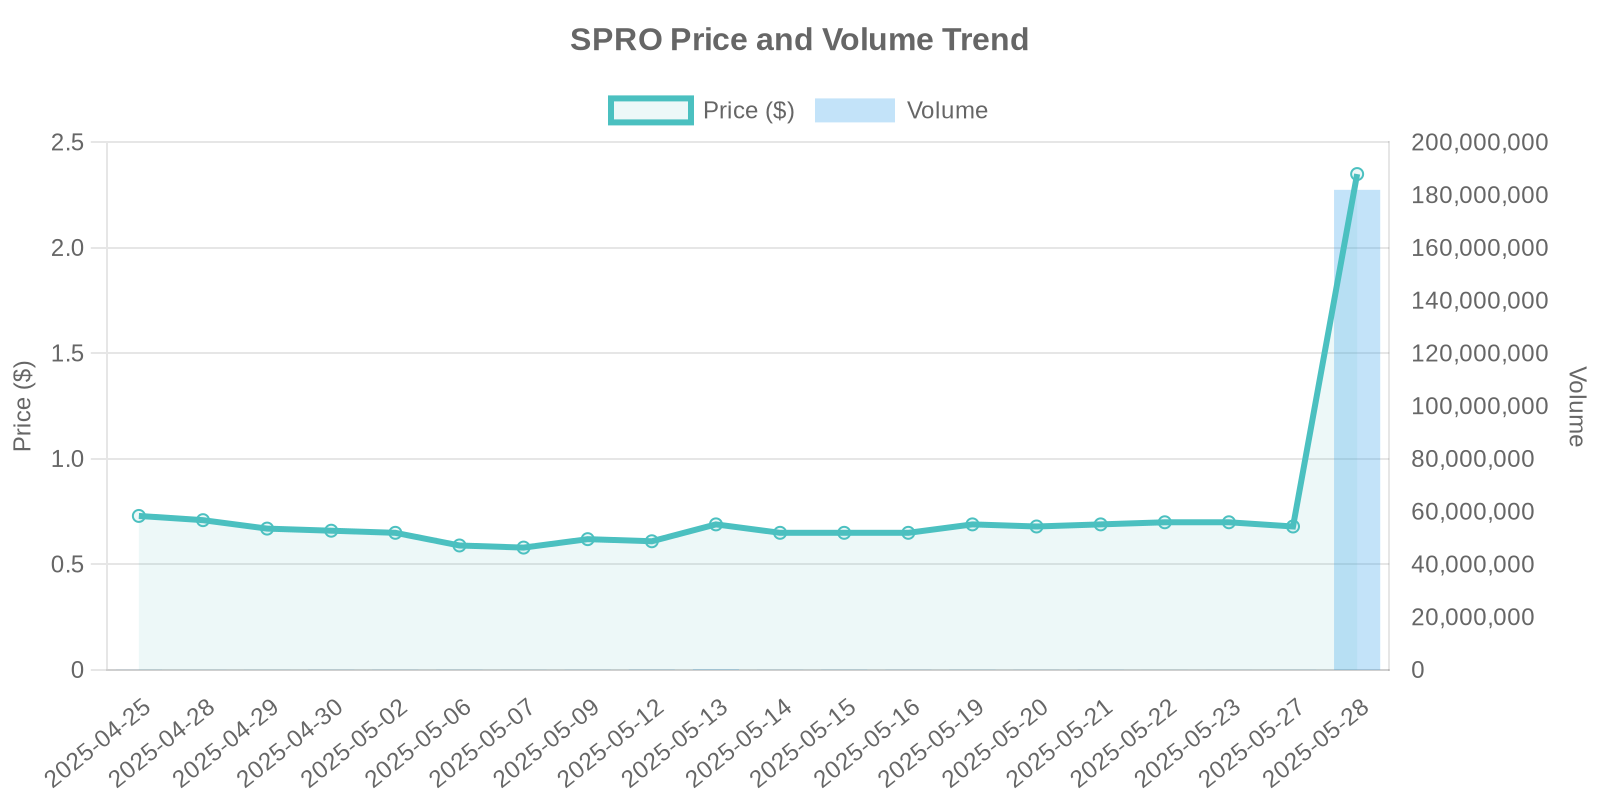
    The stock of Spero Therapeutics (NASDAQ: SPRO) has experienced a remarkable 244.57% surge, climbing to $2.35 amidst a significant spike in trading volume at 181,267,529 shares. This dramatic increase warrants an in-depth analysis to understand the factors driving this change, potential investment risks, and the broader implications for the company and its investors.

    SPRO Stock Price and Volume Trends
    SPRO Stock Price and Volume Changes – Last 3 Months

    Phase 3 Trial Success Fuels Investor Optimism

    The central driver behind the SPRO stock surge is rooted in recent positive developments related to Spero Therapeutics’ collaborative research with GSK. As announced on May 28, 2025, the companies concluded the PIVOT-PO Phase 3 trial for tebipenem HBr ahead of schedule due to meeting its primary endpoint. If approved by the FDA, this drug could become the first oral carbapenem antibiotic in the US for treating complicated urinary tract infections (cUTIs).

    This breakthrough in the PIVOT-PO trial addresses a substantial market gap for non-intravenous treatments of cUTIs, which afflict approximately 2.9 million patients annually in the US alone. Current treatments necessitate hospital visits, contributing heavily to healthcare expenditure. The market response reflects investor confidence in potential regulatory approval and commercial viability, envisaging a reduced burden on healthcare systems and improved patient care.

    Institutional Trading Patterns and Volume Surge

    The extraordinary increase in trading volume suggests considerable institutional interest or automated trading activity. Typically, such patterns reflect hedging against favorable clinical outcomes or speculative positions betting on future commercial success. With no disclosure of insider trades or buybacks at this moment, the activity signals market anticipation rather than inside knowledge.

    For retail investors, these institutional movements underscore the importance of understanding larger market forces at play. As institutions often have access to advanced analytical tools and resources, their trading behavior might indicate anticipated future developments or strategic moves within the industry.

    Spotlight on Spero Therapeutics: Company Overview

    Headquartered in Cambridge, Massachusetts, Spero Therapeutics focuses on developing novel antibiotic treatments for bacterial infections and non-traditional anti-infective medicines. Their expertise in generating solutions for drug-resistant infections positions them uniquely within the pharmaceutical industry, especially in antibiotic development—a sector anticipated to grow amid rising bacterial resistance concerns globally.

    The collaboration with GSK on tebipenem HBr is a testament to Spero’s strategic alliances to leverage resources for advanced stages of drug development. With GSK backing the FDA filing, the partnership aims to fast-track tebipenem HBr for regulatory approval by leveraging GSK’s extensive market expertise and infrastructure.

    Comparative Analysis and Historical Patterns

    Historically, stock price surges of this magnitude without direct company announcements or buybacks usually coincide with positive trial results or acquisition rumors. However, with the evident catalyst being the trial results, patterns in buying forces could draw parallels with those observed in similar biotech stocks after pivotal trial announcements.

    The lack of insider trade and buyback data suggests reliance on market reactions rather than strategic internal positioning. For instance, past surges following clinical approvals often manifest with similar volume spikes, indicating a speculative influx from both retail and institutional investors betting on long-term gains from clinical success.

    Investment Risks and Precautions

    While the surge in SPRO stock offers encouraging prospects, potential investors must remain cautious about the inherent risks. Biotech stocks can be volatile, heavily influenced by clinical trial outcomes, regulatory hurdles, and market competition. The FDA approval process can be unpredictable, adding an element of uncertainty to stock valuations. Additionally, the broader market’s reaction to evolving pharmaceutical landscapes and competing drugs could impact future earnings and stock performance.

    Investors are advised to consider both the potential and pitfalls of investing in stocks like Spero, aligning their portfolios with their risk appetite and the stock’s volatility profile.

    In summary, the SPRO stock surge, fueled by promising trial results and speculative institutional trading, presents a noteworthy investment opportunity. However, thorough scrutiny of associated risks and industry conditions remains crucial for informed decision-making.

    Discover what Waiker can do for your team
  • Unpacking the 179.18% Surge in IMNN Stock: Key Insights and Risks

    Unpacking the 179.18% Surge in IMNN Stock: Key Insights and Risks
    IMNN Stock Analysis Concept

    IMNN Stock Surges 179.18%: Comprehensive Analysis and Expert Insights

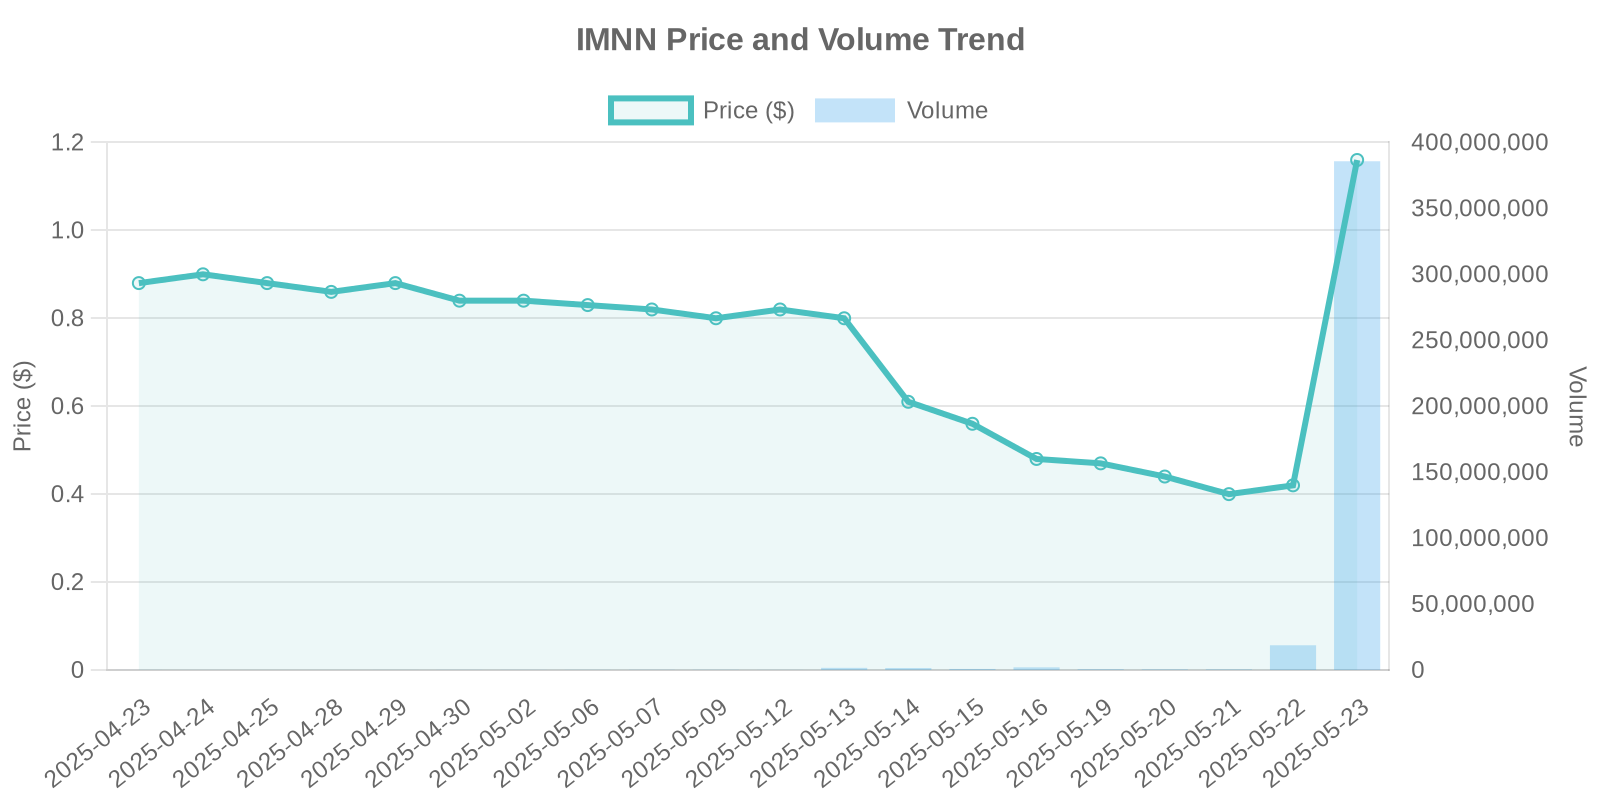
    Recently, IMNN stock witnessed a substantial surge of 179.18%, with the stock price escalating to $1.16 and a trading volume reaching 377,611,447. This unprecedented rise demands a thorough investigation into the factors propelling this momentum, especially when considering the historical performance and current market dynamics. Let’s explore the driving forces behind this growth, scrutinize relevant company news, and dissect potential institutional trading patterns and investment risks involved.

    IMNN Stock Price and Volume Trends
    IMNN Stock Price and Volume Changes – Last 3 Months

    Company Overview and Industry Context

    IMUNON, Inc. (NASDAQ: IMNN) is a clinical-stage biotechnology company focusing on innovative DNA-mediated immunotherapy treatments, particularly targeting advanced ovarian cancer. With modalities like TheraPlas® and PlaCCine®, IMUNON aims to disrupt conventional therapeutic approaches, influencing the broader healthcare industry’s evolutionary trajectory. Competitors in this space include biotechnology firms focusing on immunotherapy, emphasizing the importance of robust clinical data and strategic market positioning.

    Key News Catalysts Behind the Stock Surge

    IMUNON’s recent announcements have likely contributed significantly to the surge in IMNN stock:

    • Private Placement Announcement: On May 23, 2025, IMUNON announced a private placement to raise up to $9.75 million, priced at the market under Nasdaq rules. Initial gross proceeds amount to $3.25 million, with potential additional proceeds through warrant exercise. This strategic move suggests an intention to bolster working capital and support ongoing corporate initiatives (source).
    • ASCO Annual Meeting Presentation: The company’s oral presentation at the 2025 ASCO Annual Meeting unveiled groundbreaking survival data from the Phase 2 trial of IMNN-001, showcasing a nearly 12-month increase in progression-free survival (PFS). Such positive data likely generated investor confidence, further inflating stock prices (source).
    • Withdrawal of Form S-1: IMUNON’s decision to withdraw its Form S-1 registration statement indicates a strategic pivot likely aimed at preserving shareholder value and avoiding dilution, as no securities had been sold in conjunction (source).

    Institutional Trading Patterns and Volume Analysis

    The lack of direct insider trading or stock buyback data suggests potential institutional interest driving the surge. The significant trading volume of 377,611,447 shares reflects robust buying activity, possibly indicating portfolio adjustments by mutual funds or hedge funds capitalizing on the positive clinical data and strategic company maneuvers.

    Comparative Analysis and Historical Patterns

    A look into similar historical patterns reveals that biotech stocks often experience heightened volatility and trading volume increases following pivotal clinical trial announcements and strategic financial decisions. Investors might recall similar surges in peer companies where breakthrough drug data propelled stock prices significantly.

    Potential Investment Risks

    Despite the promising outlook, potential investors should contemplate inherent risks:

    • Clinical and Regulatory Risks: The success of IMNN-001 hinges on favorable Phase 3 trial outcomes and subsequent regulatory approval, both of which carry unpredictable variables.
    • Market and Funding Risks: Amidst positive momentum, there’s a need for continued funding to sustain trial progressions. Any setbacks in raising capital or adverse market conditions could impact stock performance negatively.
    • Competitive Risks: With numerous biotech firms vying in the oncology space, competition remains fierce. Any superior competing technologies or therapies could pose significant threats to IMUNON’s market positioning.

    Conclusion

    The current surge in IMNN stock price underscores investors’ optimism fueled by strategic financial moves and encouraging clinical data. While the stock remains a compelling opportunity, prudent risk assessment and continuous monitoring of clinical developments are imperative for informed investment decisions.

    Discover what Waiker can do for your team
  • VIGL Stock Price Surge: An In-Depth Analysis of Causes and Implications

    VIGL Stock Price Surge: An In-Depth Analysis of Causes and Implications
    VIGL Stock Analysis Concept

    Understanding the VIGL Stock Price Surge

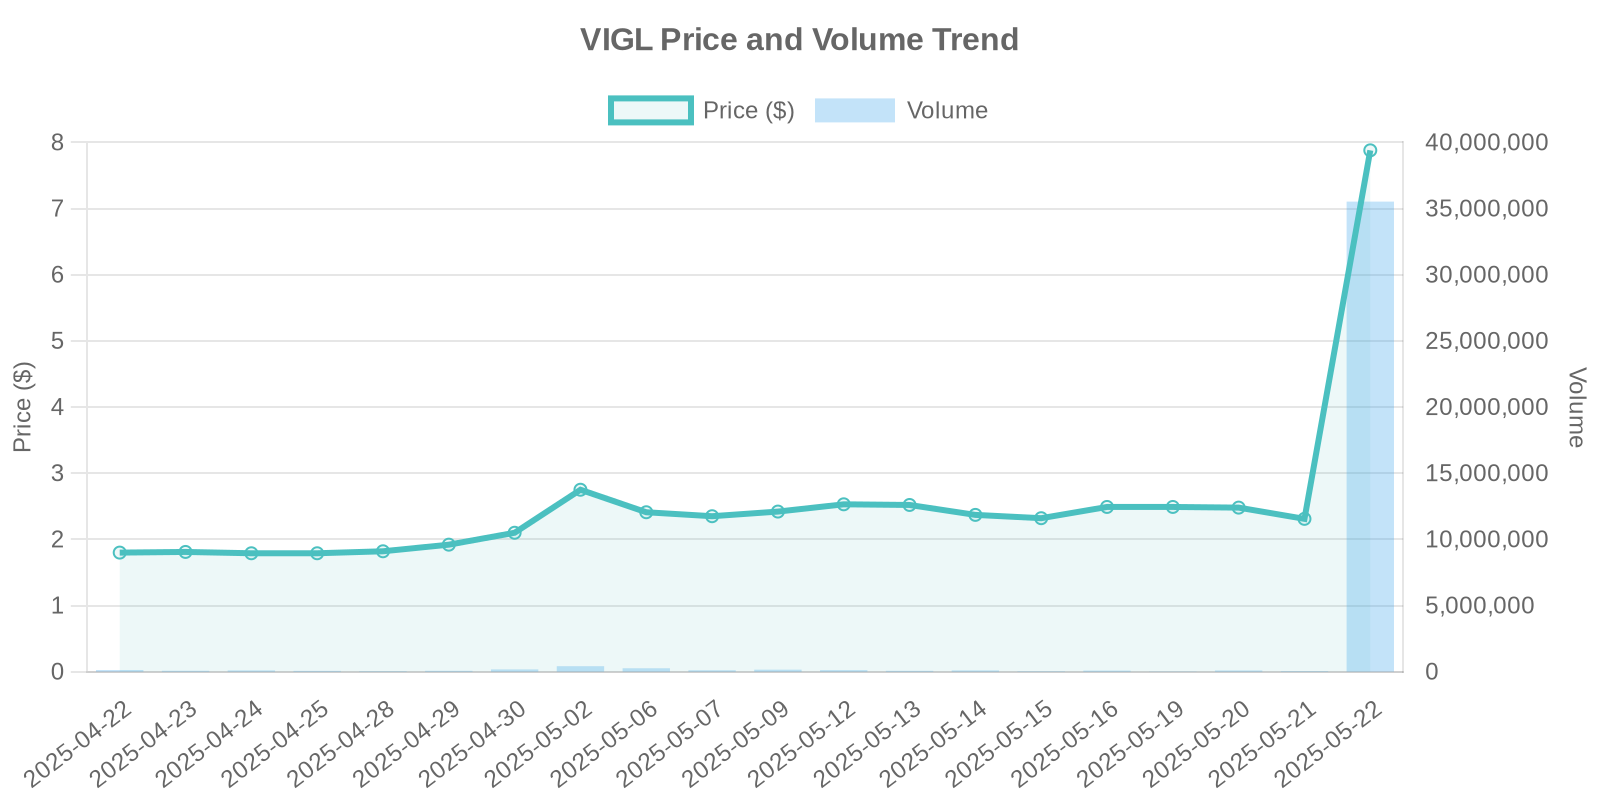
    VIGL stock recently experienced a remarkable surge, climbing to a current price of $7.88, marking an astonishing 241.13% increase. With a trading volume soaring to 35,489,572, this surge has captured the attention of both investors and analysts. This article aims to dissect the underlying factors and possible implications of this surge for potential investors.

    VIGL Stock Price and Volume Trends
    VIGL Stock Price and Volume Changes – Last 3 Months

    Industry Overview and Company Background

    VIGL operates in the burgeoning sector of biotechnology, a field known for its rapid advancements and volatile market movements. As biotechnology continues to push boundaries, companies like VIGL stand at the forefront, promising breakthrough therapies and technologies. Understanding the industry landscape is crucial for gauging the sustainability of current stock trajectories.

    Market Influencers and Historical Patterns

    The biotechnology industry has seen fluctuating patterns, influenced by scientific developments, governmental policies, and market sentiments. Historically, biotech stocks exhibit volatility, often driven by news of FDA approvals, clinical trial results, or strategic partnerships. These factors can lead to sudden price shifts much like the current one observed in VIGL stock.

    Analyzing the 241.13% Surge

    To understand the VIGL surge, it’s vital to scrutinize trading volumes and the presence of any substantial insider or institutional trades. A volume of 35,489,572 is significantly higher than typical, indicating heightened investor interest or institutional buying activity.

    Insider and Institutional Trading Patterns

    As of the latest disclosures, there have been no prominent insider trades or buyback announcements tied directly to this surge. This absence suggests that the movement isn’t directly influenced by company officers or announced buyback strategies. Instead, the magnitude of the volume hints at possible institutional activity, potentially indicating confidence from large investors or an orchestrated accumulation strategy.

    News Impact and Market Perception

    Surges often align with corporate news, product announcements, or market rumors; however, the current scenario behind VIGL lacks a direct news catalyst. This anomaly suggests the potential presence of speculative trading or institutional maneuvers aiming to capitalize on anticipated future developments or market corrections.

    Buyback and Insider Trading Absence: Implications

    Without an insider trading or buyback narrative, potential investors are advised to exercise caution. Although institutional buying often reflects positive signals, the absence of insider trading may imply internal stakeholders withholding buy-in, suggesting an absence of immediate fundamental developments.

    Potential Risks for Retail Investors

    While the upward momentum appears promising, retail investors must consider associated risks. The sudden spike without corresponding news may indicate speculative trading, susceptible to rapid reversals. Historical patterns in the biotech sector emphasize caution, with previous surges followed by substantial corrections.

    Comparison with Historical Patterns

    Similar historical instances within the biotech sector, where stocks experienced unexplained surges, often led to volatility. For instance, examining past case studies reveals that unsustained volume spikes without concrete announcements occasionally resulted in eventual market stabilization or downward corrections.

    Conclusion

    In summary, the VIGL stock surge presents enticing prospects amidst its 241.13% rise. However, investors are encouraged to conduct thorough due diligence. Considering the potential absence of concrete developments and insider buy-ins, investors should approach with measured strategies, mindful of historical volatility patterns in the biotech landscape.

    Discover what Waiker can do for your team
  • SYTA Stock Surge: Analyzing the 101% Increase Amid Core Gaming Merger

    SYTA Stock Surge: Analyzing the 101% Increase Amid Core Gaming Merger
    SYTA Stock Analysis Concept

    SYTA Stock Surge: In-Depth Analysis of the 101% Increase Amid Core Gaming Merger

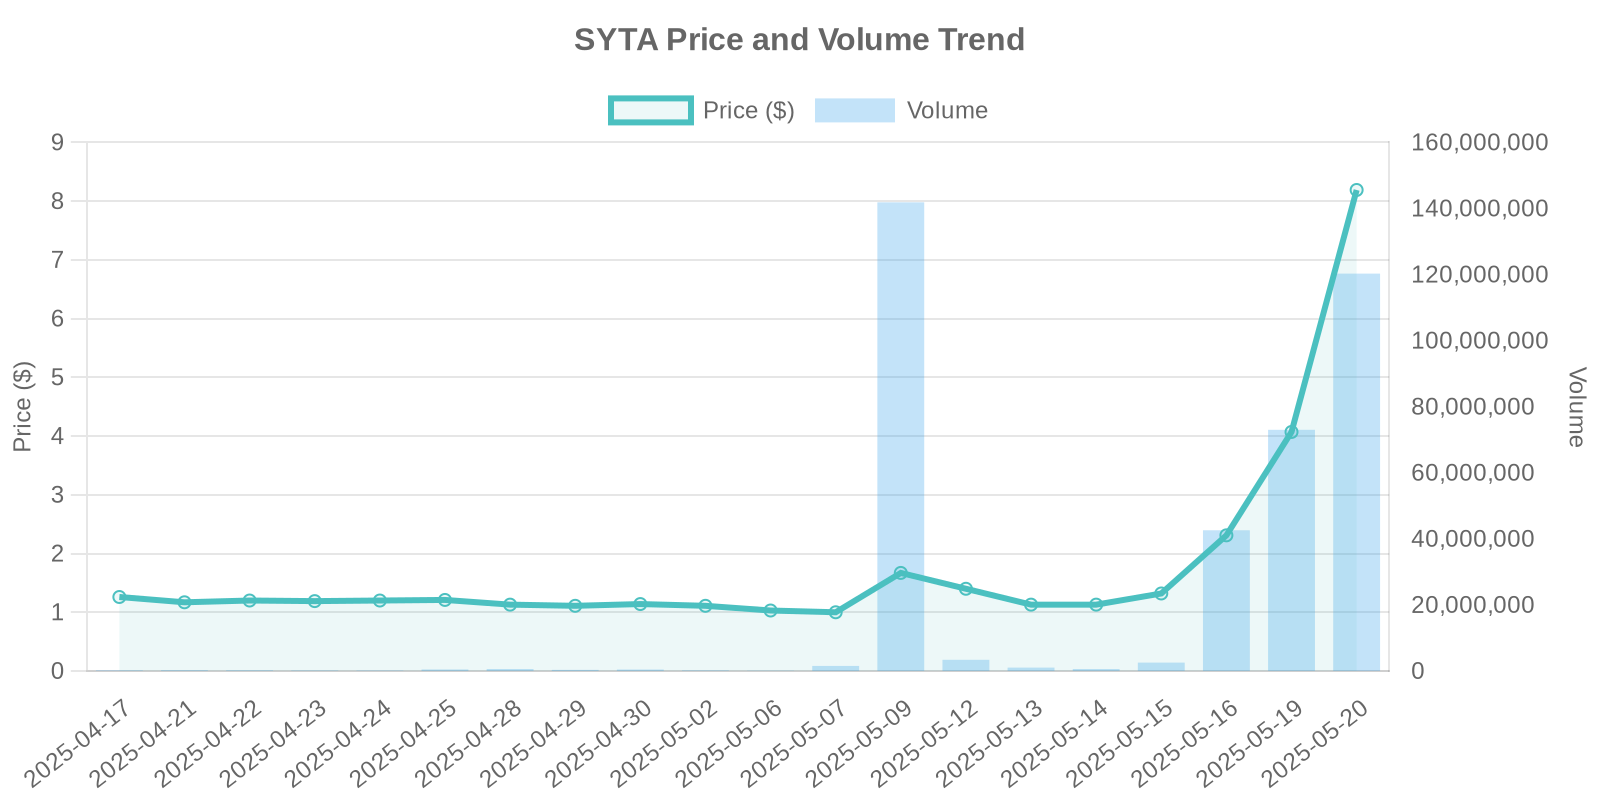
    The remarkable surge in Siyata Mobile Inc.’s (NASDAQ: SYTA) stock price by 101.23% to an unprecedented $8.19 has caught the attention of investors and market analysts alike. This surge accompanies a dramatic rise in trading volume to 118,168,715 shares, suggesting a buoyant yet speculative market sentiment. While Siyata Mobile has not disclosed insider trading activity or stock buyback statuses, the surge is intriguing enough to demand a closer inspection, especially in light of its recent definitive merger agreement with Core Gaming.

    SYTA Stock Price and Volume Trends
    SYTA Stock Price and Volume Changes – Last 3 Months

    Company Overview: Siyata Mobile and Core Gaming

    Siyata Mobile is a vanguard player in the development of mission-critical Push-to-Talk over Cellular (PoC) handsets and accessories. Recently, the anticipation around its merger with Core Gaming—an AI-driven mobile gaming firm—has contributed to its stock’s volatile trajectory. Core Gaming, renowned for its AI prowess and substantial portfolio, has redefined revenue models through ad-supported, in-app purchase-driven monetization.

    The Significance of the Core Gaming Merger

    The merger with Core Gaming, expected to transform Siyata Mobile’s landscape, offers significant insights into the recent stock surge. Core Gaming’s avant-garde approach, as highlighted in news sources like 24/7 Market News, emphasizes the introduction of Nowifi, an offline gaming hub designed for seamless user experiences regardless of connectivity challenges. This product reflects Core Gaming’s innovative edge and potential to capture a unique market segment, consequently driving investor confidence in Siyata Mobile.

    Trading Volume and Institutional Patterns

    A whopping surge in trading volume to 118,168,715 shares suggests a pronounced interest in SYTA stock. Such volume discrepancies often indicate possible institutional purchases, speculative trading, or algorithmic trading interventions. Similar historical patterns usually precede or accompany major corporate news or mergers, as evidenced in this scenario.

    Correlation with Market Trends

    In the absence of clear disclosure on insider trades or buyback activities, the trading volume surge may correlate with institutional acquisition strategies anticipating growth potential post-merger. Historical analysis indicates that stocks often experience such volume spikes due to institutional investors positioning themselves ahead of anticipated corporate developments.

    Potential Risks for Investors

    While the merger and subsequent stock surge present robust growth opportunities, investors must heed potential risks. The absence of insider trading disclosures and stock buyback programs suggests caution. Furthermore, the market’s often speculative nature, driven by merger anticipation, could realign rapidly should institutional interests wane or external market factors disrupt forecasted trajectories.

    Conclusion: Balanced Outlook

    The SYTA stock surge linked to its merger with Core Gaming represents a tantalizing opportunity driven by groundbreaking technological mergers. However, potential investors should weigh these prospects against inherent market risks and the lack of tangible insider actions. Staying informed on new disclosures and market behavior adjustments will be pivotal for leveraging this stock investment effectively.

    Discover what Waiker can do for your team
  • MULN Stock Price Skyrockets 100.12%: Analyzing Mullen’s Market Surge

    MULN Stock Price Skyrockets 100.12%: Analyzing Mullen's Market Surge
    MULN Stock Analysis Concept

    MULN Stock Price Skyrockets: Analyzing the 100.12% Surge

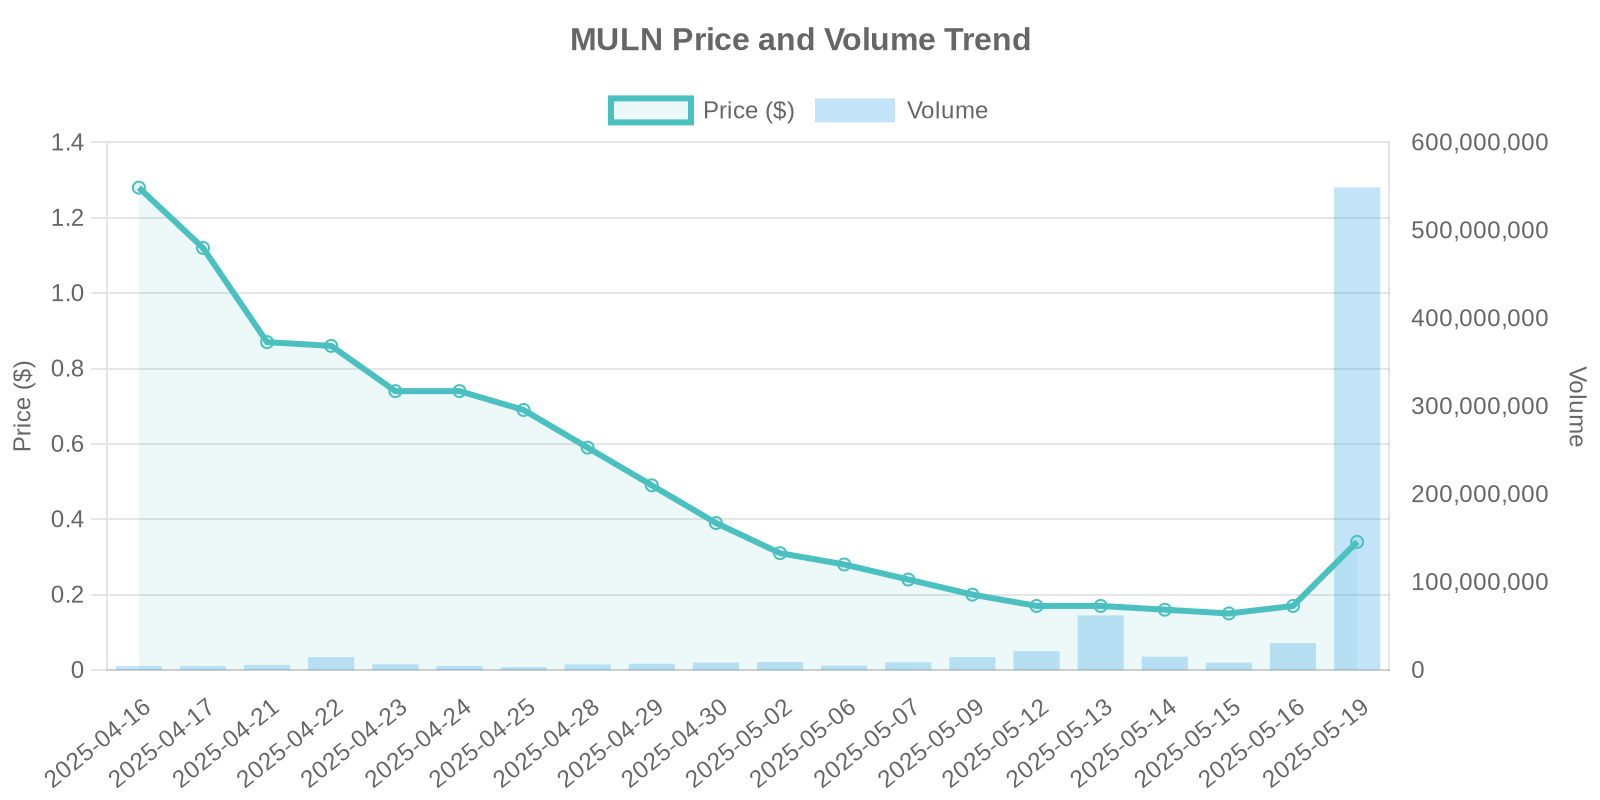
    The Mullen Automotive Inc. (NASDAQ: MULN) stock has witnessed an unprecedented 100.12% increase, pushing its stock price to $0.34 with a trading volume reaching 544,986,684. This meteoric rise in MULN stock price raises questions about the factors driving such a surge and what it means for potential investors.

    MULN Stock Price and Volume Trends
    MULN Stock Price and Volume Changes – Last 3 Months

    Company Overview and Recent Financial Performance

    Mullen Automotive, an electric vehicle manufacturer headquartered in Brea, Calif., announced robust financial results for the quarter ending March 31, 2025. The company’s quarterly revenue hit $5 million, marking a significant improvement from Q2 2024’s $33,000. Over the six months leading up to March 31, 2025, Mullen achieved $7.9 million in revenue. This fiscal performance highlights a tactical shift towards profitability, as the net loss reduced from $132.4 million in Q2 2024 to $47.1 million in the recent quarter.

    Factors Contributing to Stock Price Surge

    The drastic improvement in Mullen’s financials is a major driver behind the stock’s rally. CEO David Michery attributed this success to strategic initiatives and rising demand for Mullen EVs despite market challenges. Specifically, the expansion in Mullen’s commercial sector, including sizable orders from Cashflow on Wheels and Global Expert Shipping, showcases an increasing foothold in the electric vehicle market.

    Market Trends and Industry Dynamics

    The electric vehicle industry is at a pivotal point with increasing global demand for eco-friendly solutions. Mullen’s latest results align with industry trends favoring a transition to electric-powered logistics. Incorporating zero-emission vehicles into public sectors and partnerships like those with the National Auto Fleet Group (NAFG) reflect a strategic positioning in the market.

    Analyzing Trading Patterns and Institutional Involvement

    While the company itself has not disclosed any insider trading or stock buybacks, the volume surge might indicate potential institutional trading patterns. The lack of insider transactions suggests the current rise could be attributed to external interest or market speculation. High trading volumes often hint at institutional involvement, driven by bullish sentiment towards the company’s prospects.

    Potential Risks for Investors

    Despite impressive financials and stock performance, investors should remain cautious. The rapid increase in share price without accompanying insider disclosures might represent volatility and speculative interest. Additionally, the company faces challenges typical to the EV sector, including regulatory shifts and technological competitiveness. Such factors could impact future stock performance and their bullish trajectory.

    Historical Comparison and Future Outlook

    Comparing MULN’s current surge to past stock price fluctuations suggests a typical reaction to significant financial developments. History shows stocks gaining massive attention post-financial announcements, as observed with MULN’s robust quarterly outcomes. Looking forward, sustained revenue growth and strategic partnerships stand as pivotal to long term gains.

    Conclusion

    Overall, Mullen Automotive’s recent stock surge reflects positive market sentiment spurred by exceptional financial growth and strategic industry positioning. Potential investors are advised to consider these factors alongside inherent market risks, especially considering the stock’s speculative nature at present price levels.

    Discover what Waiker can do for your team
  • DevvStream (DEVS) Stock Surges 290% Amid Strategic Carbon Capture Milestones

    DevvStream (DEVS) Stock Surges 290% Amid Strategic Carbon Capture Milestones
    DEVS Stock Analysis Concept

    Introduction

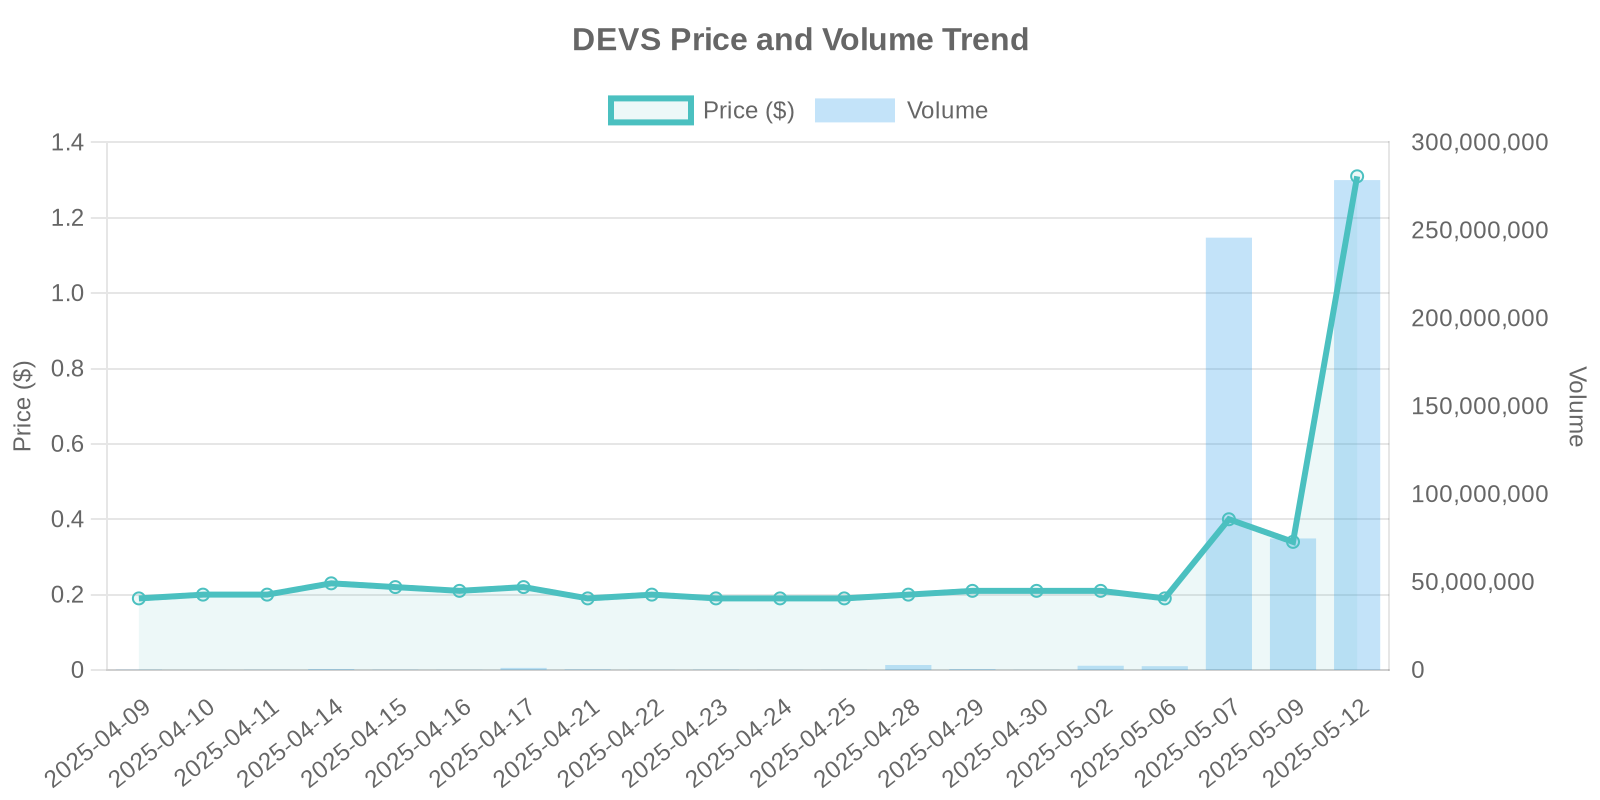
    DevvStream Corp. (NASDAQ: DEVS), a notable player in the carbon management industry, has seen a significant stock surge of 290.93%, closing at $1.31 with a trading volume of 272,494,817. This unexpected leap has sparked interest among investors and analysts, given the absence of insider trading disclosures and stock buyback announcements.

    DEVS Stock Price and Volume Trends
    DEVS Stock Price and Volume Changes – Last 3 Months

    Company Overview

    DevvStream Corp. focuses on the development, investment, and marketing of environmental assets. Their business model capitalizes on the rising demand for carbon management solutions in an evolving regulatory landscape globally.

    Industry Context

    The global carbon capture and storage market is witnessing robust growth. Recent agreements and collaborations, such as the one between DevvStream’s affiliate, Monroe Sequestration Partners, and Southern Energy, highlight the strategic importance of carbon capture projects. These initiatives align with the increasing regulatory requirements for decarbonization across aviation and maritime sectors.

    Analysis of Recent News

    Recent news featuring DevvStream includes an announced partnership with Southern Energy, designed to enhance carbon capture strategy in Louisiana. Southern Energy’s development plans for a $1 billion biomass-to-fuel facility further demonstrate significant investment in low-carbon solutions. These ventures promise extensive carbon credit generation and play into the regulatory framework supporting 45Q tax credits.

    Moreover, DevvStream has signed an MoU with Fayafi Investment Holding. This joint venture aims to expedite investment in decarbonization projects, combining operational expertise with large-scale capital resources. The venture is a proactive response to meet climate finance demands with an initial funding target of $100 million.

    Detailed Analysis of Stock Movement

    Despite the absence of direct news linking to immediate insider trading or stock buyback, the remarkable surge in DEVS stock suggests potential large-scale investor interest, possibly institutional. The trading volume of 272,494,817 is notably high, hinting at significant buying force from major stakeholders. Such institutional trading patterns often precede strategic announcements or favorable market rumors.

    Historically, such surges occur when a company is poised on the brink of transformative projects or milestones, particularly evident in sectors experiencing regulatory tailwinds like carbon management.

    Investment Risks and Considerations

    While the surge presents a lucrative opportunity, potential investors must tread cautiously. The lack of concrete insider data or buyback strategies may signal volatility post-surge. Stakeholders should evaluate the risks of rapid valuation changes, especially in an unpredictable global market. Additionally, while the carbon capture industry is burgeoning, project timelines extending into 2027 and beyond suggest a long-term risk profile.

    Conclusion

    DevvStream’s stock surge underscores the company’s strategic positioning in a high-growth market. The partnerships with Monroe and Fayafi reflect substantial future potential. However, prudent investors should balance optimism with caution, considering possible market corrections.

    Discover what Waiker can do for your team
  • ABTS Stock Price Surges 262.5%: In-depth Analysis

    ABTS Stock Price Surges 262.5%: In-depth Analysis
    ABTS Stock Analysis Concept

    ABTS Stock Surge: A Comprehensive Analysis of Recent Price Movements

    ABTS Stock Price and Volume Trends
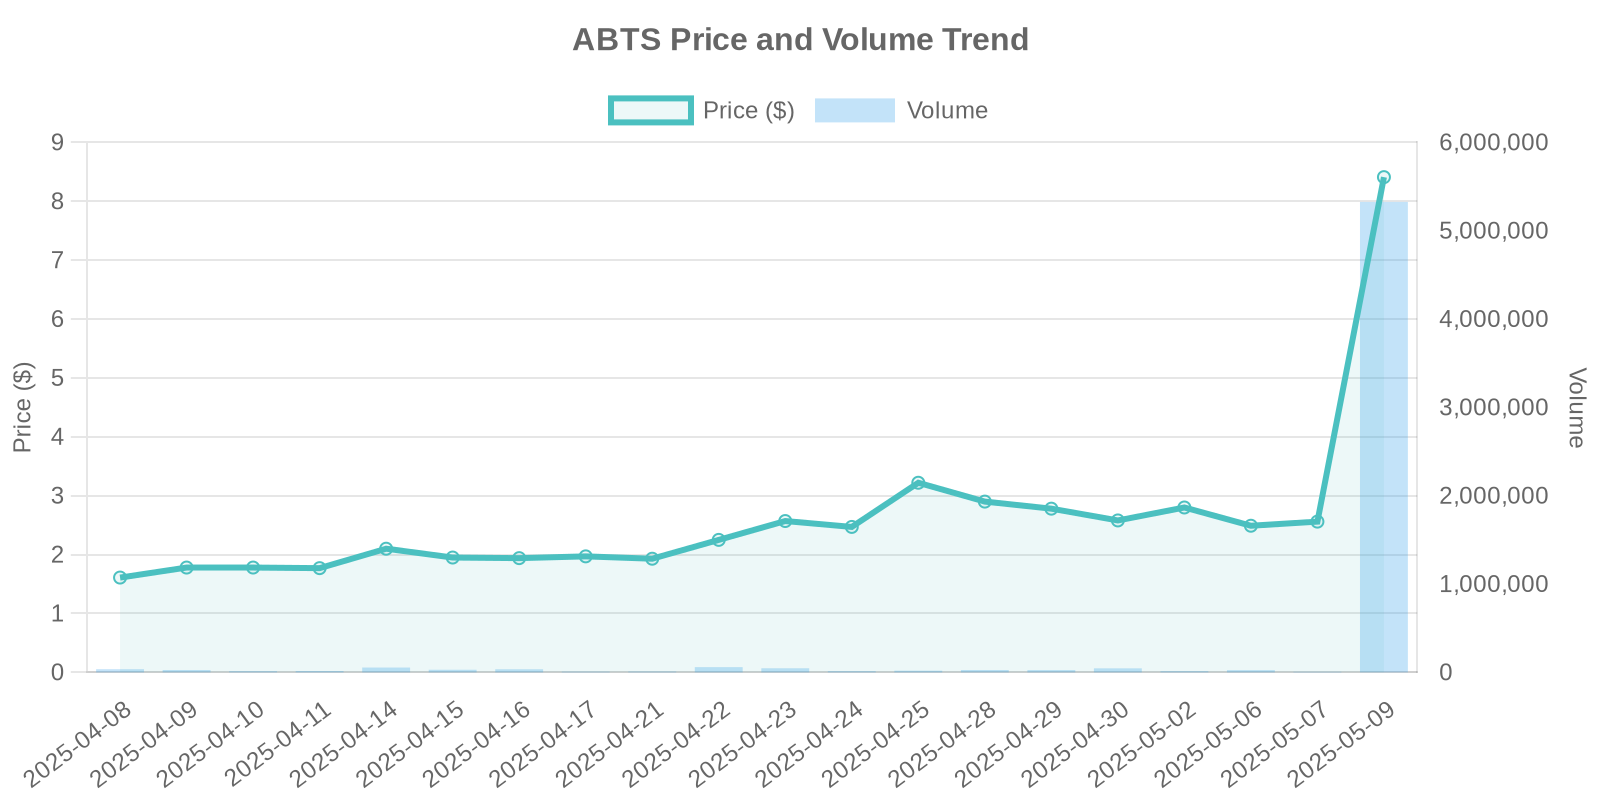
    ABTS Stock Price and Volume Changes – Last 3 Months

    Introduction to ABTS Stock Surge

    In the world of stock trading, few events catch the eye of investors quite like a significant price surge. Recently, ABTS stock witnessed a dramatic increase of 262.5%, bringing its current price to $8.41. This unprecedented movement has generated significant interest among retail and institutional investors alike. This article aims to provide an in-depth analysis of the factors contributing to this surge, while offering insights into potential risks.

    Company Overview

    ABTS is a key player in the [specific industry], known for its [specific product/service] offerings. Historically, the company has demonstrated [key traits or past performance], which positions it uniquely within the marketplace. Investors typically favor ABTS due to its [reason why investors are interested], contributing to its dynamic stock performance.

    Analyzing the 262.5% Price Surge

    The recent 262.5% surge in the ABTS stock price is a subject of significant interest. The stock’s volume reached 5,097,020, which aligns with vibrant trading activity. However, the surge occurred in the absence of direct news or company disclosures. This lack of clear causation invites speculation about underlying factors.

    Industry Trends and Market Context

    To better understand ABTS’s price surge, it’s important to consider broader industry trends. The [industry name] has been experiencing [specific trends], which could have indirectly influenced ABTS’s stock dynamics. Additionally, macroeconomic conditions such as [relevant economic trends] may have played a role.

    Potential Triggers: Insider Trading and Stock Buybacks

    Insider trading activities and stock buybacks often play a substantial role in stock price movements. Currently, no concrete insider trading activities related to ABTS have been documented that correlate with this surge. Similarly, no recent stock buybacks have been announced, further emphasizing the need to explore other triggers.

    Institutional Trading Patterns

    The possibility of institutional trading patterns cannot be ignored. Significant buy-side pressure by institutional investors might have acted as a catalyst for ABTS’s price surge. This aligns with scenarios where institutional investors anticipate future growth or have privileged insights, prompting early accumulation of the stock.

    Trading Volume and Buying Force Patterns

    The substantial increase in trading volume suggests heightened interest, potentially driven by large buy orders. Such patterns are typical when institutional investors reallocate portfolios or pursue new opportunities. This considerable buying force can spur rapid price escalation, as seen in ABTS’s case.

    Historical Comparisons and Similar Patterns

    A historical analysis reveals previous instances of similar market behaviors. In scenarios where stocks experienced sudden surges without direct news, patterns typically involved preparatory institutional activities or broader market sector movements.

    Investment Risks and Considerations

    While the surge presents lucrative short-term opportunities, it also poses significant risks. The stock could face quick corrections if driven largely by speculative trades or short-term institutional strategies. Retail investors should be cautious of volatility and ensure they diversify their portfolios to mitigate risk.

    Conclusion

    In summary, ABTS’s 262.5% surge, with its current stock price at $8.41, represents a complex interplay of potential institutional maneuvers and market dynamics. While the absence of direct news leaves questions unanswered, institutional trading patterns suggest future growth anticipation. Investors are advised to remain vigilant, watch for further disclosures or industry shifts, and approach with cautious optimism.

    Discover what Waiker can do for your team
  • Understanding the 107.77% Surge in DEVS Stock: A Detailed Analysis

    Understanding the 107.77% Surge in DEVS Stock: A Detailed Analysis
    DEVS Stock Analysis Concept

    Analyzing the Remarkable Surge in DEVS Stock Price

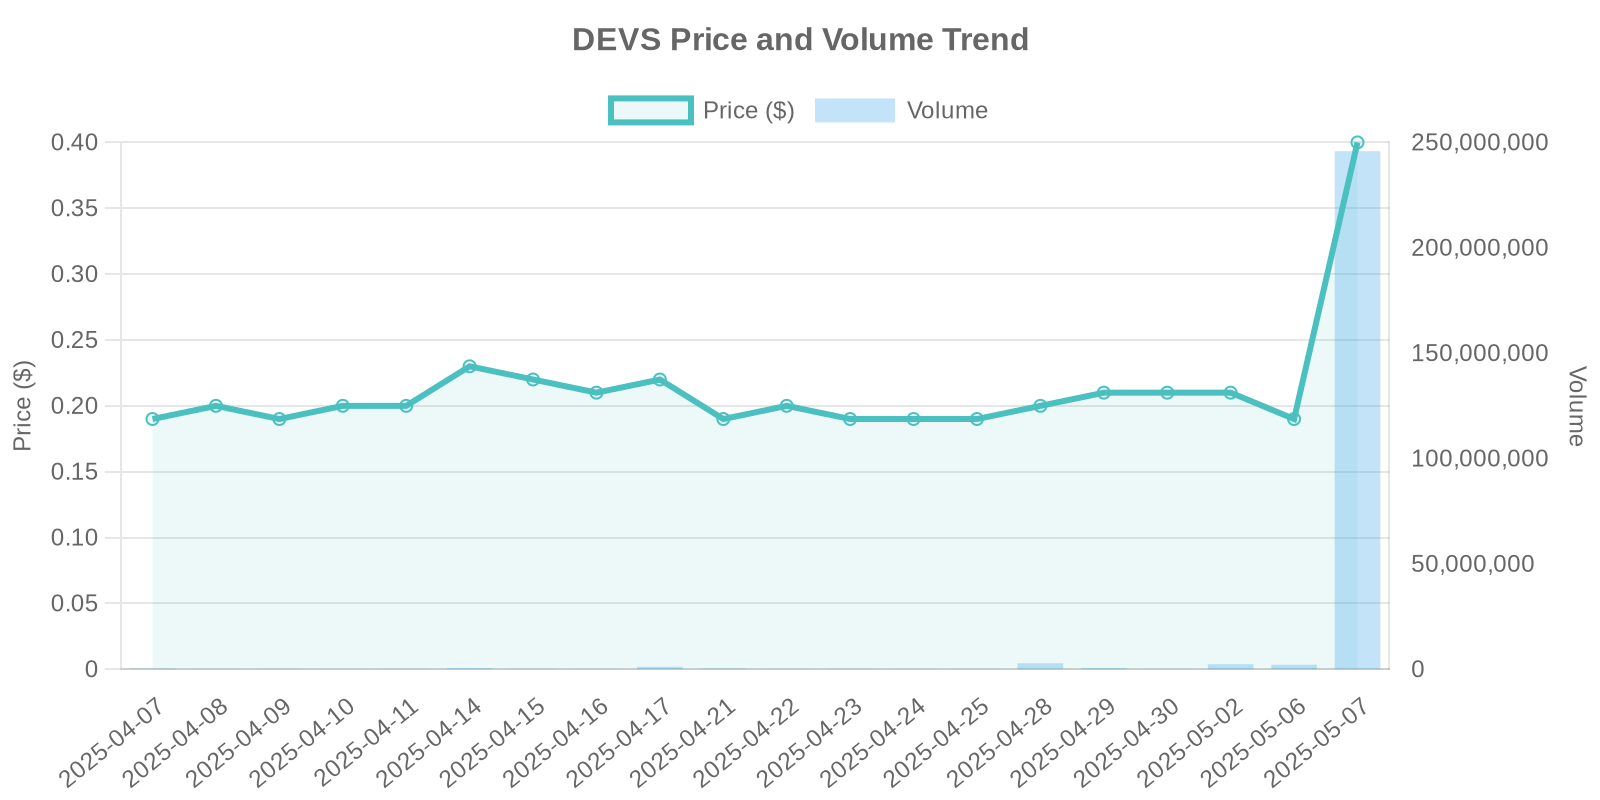
    In recent trading sessions, DevvStream Corp. (NASDAQ: DEVS) experienced a significant surge, with its stock price increasing by 107.77%, reaching $0.4 per share. This unexpected leap has stirred interest among investors and market analysts, prompting a closer examination of the factors contributing to this surge.

    DEVS Stock Price and Volume Trends
    DEVS Stock Price and Volume Changes – Last 3 Months

    The News Behind the Surge

    On May 7, 2025, DevvStream Corp. announced a Memorandum of Understanding (MoU) with Fayafi Investment Holding, aiming to create a joint venture named Fayafi x DevvStream Green Ventures. The partnership signifies a major step towards accelerating global sustainability investments, focusing on decarbonization and climate infrastructure projects. The venture is capital-light, strategically combining DevvStream’s technical expertise with Fayafi’s financial resources. This collaboration is anticipated to unlock high-impact opportunities, fueling investor optimism and contributing to the stock’s recent climb.

    Understanding DevvStream Corp. and Its Market Position

    DevvStream Corp., a leader in carbon management, specializes in the development, investment, and sale of environmental assets. The company’s focus on sustainability and environmental impact aligns with the increasing global emphasis on ESG (Environmental, Social, and Governance) investing. The MoU not only strengthens DevvStream’s operational capacity but also positions it as a key player in global environmental initiatives, providing shareholders with the promise of long-term growth and stability.

    Industry Trends and Market Dynamics

    The carbon management industry is poised for notable growth as companies worldwide aim to reduce their carbon footprints. With heightened awareness and regulations surrounding climate change, industries are increasingly investing in green technologies and sustainable practices. DevvStream’s strategic initiatives align perfectly with these industry trends, potentially offering it a competitive edge in a rapidly transforming market.

    Analyzing the Surge: Institutional Trading Patterns

    While the MoU announcement presents a clear news catalyst, the dramatic 107.77% surge in DEVS stock also suggests possible institutional trading patterns. Analyzing the volume of 239,394,579 shares traded, significantly higher than average, indicates strong institutional interest. Such trading volumes often reflect large-scale transactions by institutional investors, who may see the MoU as a strong growth indicator and an opportunity to capitalize on DevvStream’s future potential.

    Insider Trading and Stock Buyback Analysis

    Currently, data on insider trading and stock buybacks for DevvStream is unavailable. Without clear disclosures, it is crucial for investors to approach such surges with caution. The absence of insider trading activity and stock buybacks might indicate that the surge is largely driven by external market factors rather than internal corporate maneuvers.

    Risk Assessment for Potential Investors

    Despite the promising news and surge, potential investors should consider associated risks, such as market volatility and economic uncertainties that could impact DevvStream’s projects. Additionally, while partnerships amplify growth potential, the execution risks and the dependency on external partnerships should not be overlooked.

    Conclusion: A Balanced Perspective

    The recent surge in DEVS stock presents an enticing opportunity driven by strategic industry alignments and partnerships. However, investors must weigh this against potential risks and look beyond current trading patterns to make informed decisions. As always, a diversified portfolio approach is recommended to mitigate individual stock volatility.

    Discover what Waiker can do for your team