IMNN Stock Surges 179.18%: Comprehensive Analysis and Expert Insights
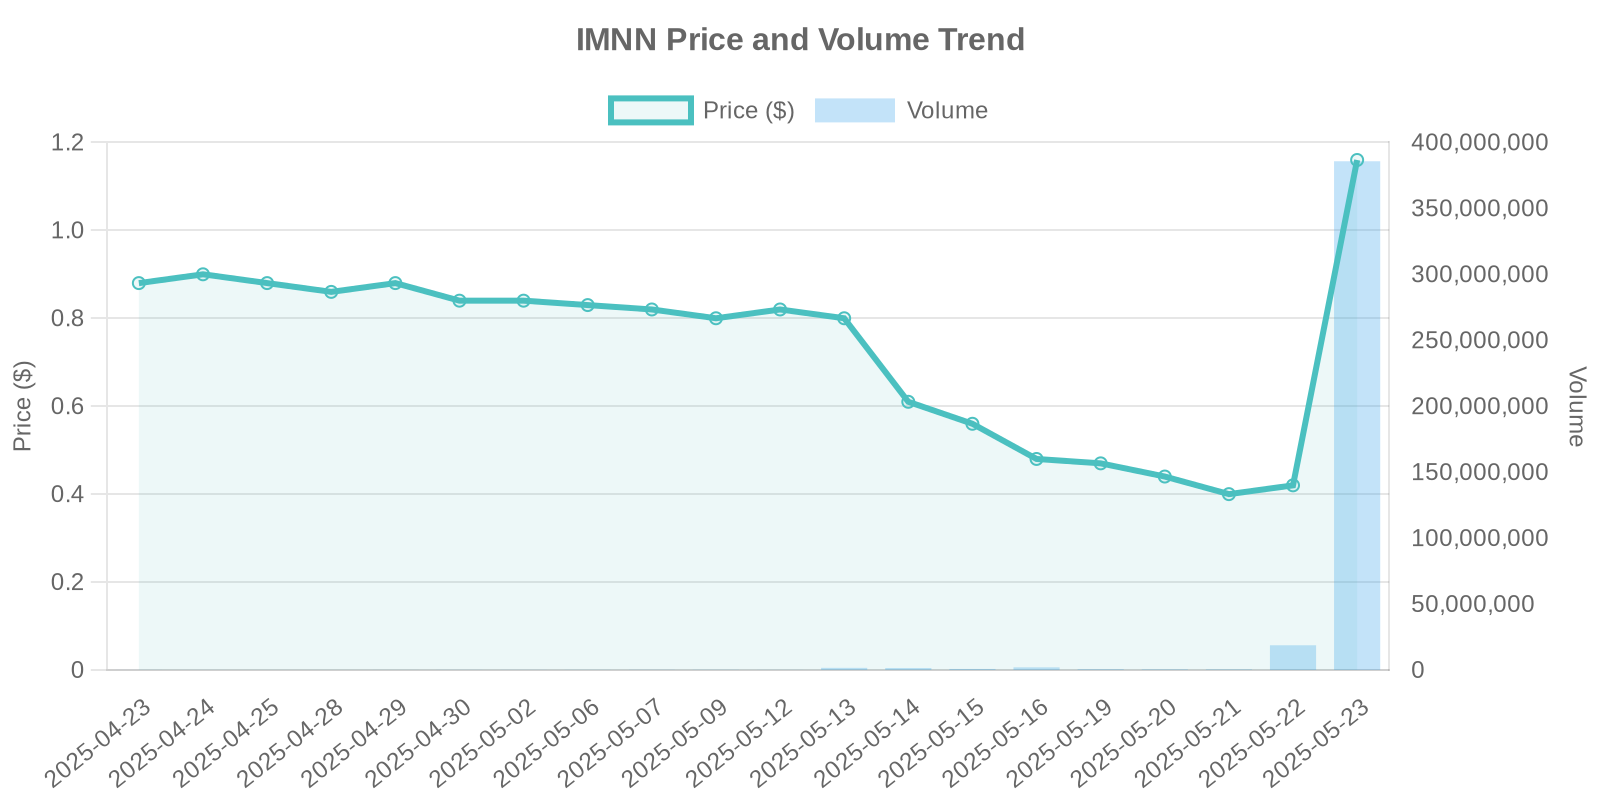
Recently, IMNN stock witnessed a substantial surge of 179.18%, with the stock price escalating to $1.16 and a trading volume reaching 377,611,447. This unprecedented rise demands a thorough investigation into the factors propelling this momentum, especially when considering the historical performance and current market dynamics. Let’s explore the driving forces behind this growth, scrutinize relevant company news, and dissect potential institutional trading patterns and investment risks involved.
Company Overview and Industry Context
IMUNON, Inc. (NASDAQ: IMNN) is a clinical-stage biotechnology company focusing on innovative DNA-mediated immunotherapy treatments, particularly targeting advanced ovarian cancer. With modalities like TheraPlas® and PlaCCine®, IMUNON aims to disrupt conventional therapeutic approaches, influencing the broader healthcare industry’s evolutionary trajectory. Competitors in this space include biotechnology firms focusing on immunotherapy, emphasizing the importance of robust clinical data and strategic market positioning.
Key News Catalysts Behind the Stock Surge
IMUNON’s recent announcements have likely contributed significantly to the surge in IMNN stock:
- Private Placement Announcement: On May 23, 2025, IMUNON announced a private placement to raise up to $9.75 million, priced at the market under Nasdaq rules. Initial gross proceeds amount to $3.25 million, with potential additional proceeds through warrant exercise. This strategic move suggests an intention to bolster working capital and support ongoing corporate initiatives (source).
- ASCO Annual Meeting Presentation: The company’s oral presentation at the 2025 ASCO Annual Meeting unveiled groundbreaking survival data from the Phase 2 trial of IMNN-001, showcasing a nearly 12-month increase in progression-free survival (PFS). Such positive data likely generated investor confidence, further inflating stock prices (source).
- Withdrawal of Form S-1: IMUNON’s decision to withdraw its Form S-1 registration statement indicates a strategic pivot likely aimed at preserving shareholder value and avoiding dilution, as no securities had been sold in conjunction (source).
Institutional Trading Patterns and Volume Analysis
The lack of direct insider trading or stock buyback data suggests potential institutional interest driving the surge. The significant trading volume of 377,611,447 shares reflects robust buying activity, possibly indicating portfolio adjustments by mutual funds or hedge funds capitalizing on the positive clinical data and strategic company maneuvers.
Comparative Analysis and Historical Patterns
A look into similar historical patterns reveals that biotech stocks often experience heightened volatility and trading volume increases following pivotal clinical trial announcements and strategic financial decisions. Investors might recall similar surges in peer companies where breakthrough drug data propelled stock prices significantly.
Potential Investment Risks
Despite the promising outlook, potential investors should contemplate inherent risks:
- Clinical and Regulatory Risks: The success of IMNN-001 hinges on favorable Phase 3 trial outcomes and subsequent regulatory approval, both of which carry unpredictable variables.
- Market and Funding Risks: Amidst positive momentum, there’s a need for continued funding to sustain trial progressions. Any setbacks in raising capital or adverse market conditions could impact stock performance negatively.
- Competitive Risks: With numerous biotech firms vying in the oncology space, competition remains fierce. Any superior competing technologies or therapies could pose significant threats to IMUNON’s market positioning.
Conclusion
The current surge in IMNN stock price underscores investors’ optimism fueled by strategic financial moves and encouraging clinical data. While the stock remains a compelling opportunity, prudent risk assessment and continuous monitoring of clinical developments are imperative for informed investment decisions.